Austrian 2 or more Vehicles in Household

COMPARE

Austrian
Race
Ancestry
AfghanAfricanAlaska NativeAlaskan AthabascanAlbanianAleutAlsatianAmericanApacheArabArapahoArgentineanArmenianAssyrian/Chaldean/SyriacAustralianAustrianBahamianBangladeshiBarbadianBasqueBelgianBelizeanBermudanBhutaneseBlackfeetBolivianBrazilianBritishBritish West IndianBulgarianBurmeseCajunCambodianCanadianCape VerdeanCarpatho RusynCelticCentral AmericanCentral American IndianCherokeeCheyenneChickasawChileanChineseChippewaChoctawColombianColvilleComancheCosta RicanCreeCreekCroatianCrowCubanCypriotCzechCzechoslovakianDanishDelawareDominicanDutchDutch West IndianEastern EuropeanEcuadorianEgyptianEnglishEstonianEthiopianEuropeanFijianFilipinoFinnishFrenchFrench American IndianFrench CanadianGermanGerman RussianGhanaianGreekGuamanian/ChamorroGuatemalanGuyaneseHaitianHmongHonduranHopiHoumaHungarianIcelanderIndian (Asian)IndonesianInupiatIranianIraqiIrishIroquoisIsraeliItalianJamaicanJapaneseJordanianKenyanKiowaKoreanLaotianLatvianLebaneseLiberianLithuanianLumbeeLuxembourgerMacedonianMalaysianMalteseMarshalleseMenomineeMexicanMexican American IndianMongolianMoroccanNative HawaiianNavajoNepaleseNew ZealanderNicaraguanNigerianNorthern EuropeanNorwegianOkinawanOsageOttawaPaiutePakistaniPalestinianPanamanianParaguayanPennsylvania GermanPeruvianPimaPolishPortuguesePotawatomiPuebloPuerto RicanPuget Sound SalishRomanianRussianSalvadoranSamoanScandinavianScotch-IrishScottishSeminoleSenegaleseSerbianShoshoneSierra LeoneanSiouxSlavicSlovakSloveneSomaliSouth AfricanSouth AmericanSouth American IndianSoviet UnionSpaniardSpanishSpanish AmericanSpanish American IndianSri LankanSubsaharan AfricanSudaneseSwedishSwissSyrianTaiwaneseThaiTlingit-HaidaTohono O'OdhamTonganTrinidadian and TobagonianTsimshianTurkishU.S. Virgin IslanderUgandanUkrainianUruguayanUteVenezuelanVietnameseWelshWest IndianYakamaYaquiYugoslavianYumanYup'ikZimbabwean
Immigration
NonimmigrantsImmigrantsAfghanistanAfricaAlbaniaArgentinaArmeniaAsiaAustraliaAustriaBahamasBangladeshBarbadosBelarusBelgiumBelizeBoliviaBosnia and HerzegovinaBrazilBulgariaBurma/MyanmarCabo VerdeCambodiaCameroonCanadaCaribbeanCentral AmericaChileChinaColombiaCongoCosta RicaCroatiaCubaCzechoslovakiaDenmarkDominicaDominican RepublicEastern AfricaEastern AsiaEastern EuropeEcuadorEgyptEl SalvadorEnglandEritreaEthiopiaEuropeFijiFranceGermanyGhanaGreeceGrenadaGuatemalaGuyanaHaitiHondurasHong KongHungaryIndiaIndonesiaIranIraqIrelandIsraelItalyJamaicaJapanJordanKazakhstanKenyaKoreaKuwaitLaosLatin AmericaLatviaLebanonLiberiaLithuaniaMalaysiaMexicoMicronesiaMiddle AfricaMoldovaMoroccoNepalNetherlandsNicaraguaNigeriaNorth AmericaNorth MacedoniaNorthern AfricaNorthern EuropeNorwayOceaniaPakistanPanamaPeruPhilippinesPolandPortugalRomaniaRussiaSaudi ArabiaScotlandSenegalSerbiaSierra LeoneSingaporeSomaliaSouth AfricaSouth AmericaSouth Central AsiaSouth Eastern AsiaSouthern EuropeSpainSri LankaSt. Vincent and the GrenadinesSudanSwedenSwitzerlandSyriaTaiwanThailandTrinidad and TobagoTurkeyUgandaUkraineUruguayUzbekistanVenezuelaVietnamWest IndiesWestern AfricaWestern AsiaWestern EuropeYemenZaireZimbabweAzores
Select to Compare
Race
Ancestry
AfghanAfricanAlaska NativeAlaskan AthabascanAlbanianAleutAlsatianAmericanApacheArabArapahoArgentineanArmenianAssyrian/Chaldean/SyriacAustralianBahamianBangladeshiBarbadianBasqueBelgianBelizeanBermudanBhutaneseBlackfeetBolivianBrazilianBritishBritish West IndianBulgarianBurmeseCajunCambodianCanadianCape VerdeanCarpatho RusynCelticCentral AmericanCentral American IndianCherokeeCheyenneChickasawChileanChineseChippewaChoctawColombianColvilleComancheCosta RicanCreeCreekCroatianCrowCubanCypriotCzechCzechoslovakianDanishDelawareDominicanDutchDutch West IndianEastern EuropeanEcuadorianEgyptianEnglishEstonianEthiopianEuropeanFijianFilipinoFinnishFrenchFrench American IndianFrench CanadianGermanGerman RussianGhanaianGreekGuamanian/ChamorroGuatemalanGuyaneseHaitianHmongHonduranHopiHoumaHungarianIcelanderIndian (Asian)IndonesianInupiatIranianIraqiIrishIroquoisIsraeliItalianJamaicanJapaneseJordanianKenyanKiowaKoreanLaotianLatvianLebaneseLiberianLithuanianLumbeeLuxembourgerMacedonianMalaysianMalteseMarshalleseMenomineeMexicanMexican American IndianMongolianMoroccanNative HawaiianNavajoNepaleseNew ZealanderNicaraguanNigerianNorthern EuropeanNorwegianOkinawanOsageOttawaPaiutePakistaniPalestinianPanamanianParaguayanPennsylvania GermanPeruvianPimaPolishPortuguesePotawatomiPuebloPuerto RicanPuget Sound SalishRomanianRussianSalvadoranSamoanScandinavianScotch-IrishScottishSeminoleSenegaleseSerbianShoshoneSierra LeoneanSiouxSlavicSlovakSloveneSomaliSouth AfricanSouth AmericanSouth American IndianSoviet UnionSpaniardSpanishSpanish AmericanSpanish American IndianSri LankanSubsaharan AfricanSudaneseSwedishSwissSyrianTaiwaneseThaiTlingit-HaidaTohono O'OdhamTonganTrinidadian and TobagonianTsimshianTurkishU.S. Virgin IslanderUgandanUkrainianUruguayanUteVenezuelanVietnameseWelshWest IndianYakamaYaquiYugoslavianYumanYup'ikZimbabwean
Immigration
NonimmigrantsImmigrantsAfghanistanAfricaAlbaniaArgentinaArmeniaAsiaAustraliaAustriaBahamasBangladeshBarbadosBelarusBelgiumBelizeBoliviaBosnia and HerzegovinaBrazilBulgariaBurma/MyanmarCabo VerdeCambodiaCameroonCanadaCaribbeanCentral AmericaChileChinaColombiaCongoCosta RicaCroatiaCubaCzechoslovakiaDenmarkDominicaDominican RepublicEastern AfricaEastern AsiaEastern EuropeEcuadorEgyptEl SalvadorEnglandEritreaEthiopiaEuropeFijiFranceGermanyGhanaGreeceGrenadaGuatemalaGuyanaHaitiHondurasHong KongHungaryIndiaIndonesiaIranIraqIrelandIsraelItalyJamaicaJapanJordanKazakhstanKenyaKoreaKuwaitLaosLatin AmericaLatviaLebanonLiberiaLithuaniaMalaysiaMexicoMicronesiaMiddle AfricaMoldovaMoroccoNepalNetherlandsNicaraguaNigeriaNorth AmericaNorth MacedoniaNorthern AfricaNorthern EuropeNorwayOceaniaPakistanPanamaPeruPhilippinesPolandPortugalRomaniaRussiaSaudi ArabiaScotlandSenegalSerbiaSierra LeoneSingaporeSomaliaSouth AfricaSouth AmericaSouth Central AsiaSouth Eastern AsiaSouthern EuropeSpainSri LankaSt. Vincent and the GrenadinesSudanSwedenSwitzerlandSyriaTaiwanThailandTrinidad and TobagoTurkeyUgandaUkraineUruguayUzbekistanVenezuelaVietnamWest IndiesWestern AfricaWestern AsiaWestern EuropeYemenZaireZimbabweAzores
2 or more Vehicles in Household
Income
Poverty
Unemployment
Labor Participation
Family Structure
Vehicle Availability
Education Level
Disability

Austrian 2 or more Vehicles in Household
Exceptional

58.4%
2+ VEHICLES AVAILABLE
99.6/ 100
METRIC RATING
72nd/ 347
METRIC RANK

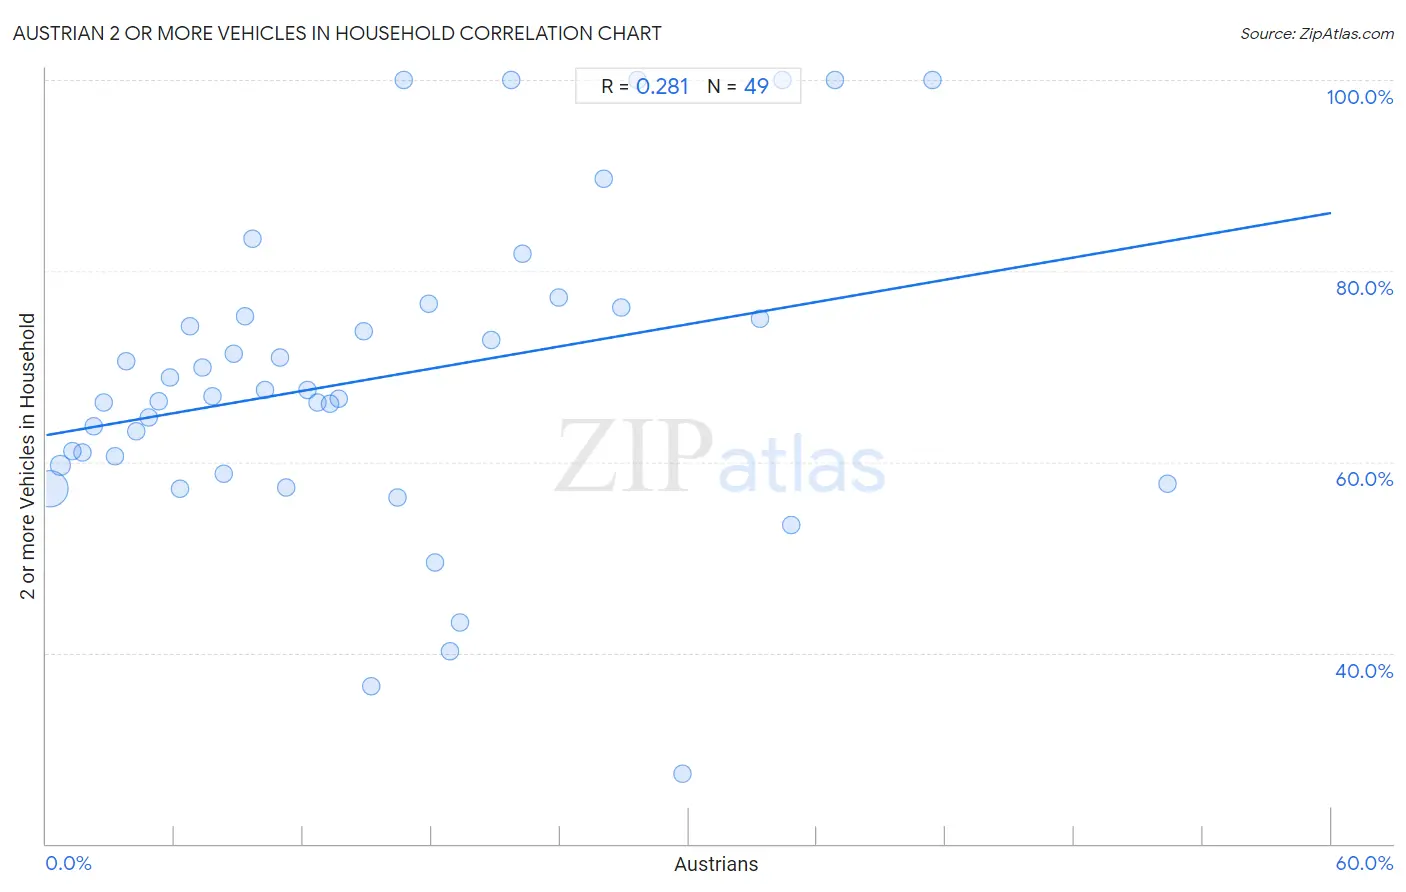
Austrian 2 or more Vehicles in Household Correlation Chart

The statistical analysis conducted on geographies consisting of 451,851,074 people shows a weak positive correlation between the proportion of Austrians and percentage of households with 2 or more vehicles available in the United States with a correlation coefficient (R) of 0.281 and weighted average of 58.4%. On average, for every 1% (one percent) increase in Austrians within a typical geography, there is an increase of 0.39% in percentage of households with 2 or more vehicles available.
Austrian 2 or more Vehicles in Household
It is essential to understand that the correlation between the percentage of Austrians and percentage of households with 2 or more vehicles available does not imply a direct cause-and-effect relationship. It remains uncertain whether the presence of Austrians influences an upward or downward trend in the level of percentage of households with 2 or more vehicles available within an area, or if Austrians simply ended up residing in those areas with higher or lower levels of percentage of households with 2 or more vehicles available due to other factors.

Demographics Similar to Austrians by 2 or more Vehicles in Household

In terms of 2 or more vehicles in household, the demographic groups most similar to Austrians are Bangladeshi (58.4%, a difference of 0.030%), Italian (58.4%, a difference of 0.050%), Bolivian (58.3%, a difference of 0.12%), Immigrants from Afghanistan (58.3%, a difference of 0.13%), and Pennsylvania German (58.5%, a difference of 0.16%).
DemographicsRating | Rank2 or more Vehicles in Household
Immigrants from Central America
99.7
/100
|
#65
Exceptional
58.6%
Croatians
99.7
/100
|
#66
Exceptional
58.6%
Laotians
99.7
/100
|
#67
Exceptional
58.6%
Canadians
99.7
/100
|
#68
Exceptional
58.6%
Pennsylvania Germans
99.7
/100
|
#69
Exceptional
58.5%
Italians
99.6
/100
|
#70
Exceptional
58.4%
Bangladeshis
99.6
/100
|
#71
Exceptional
58.4%
Austrians
99.6
/100
|
#72
Exceptional
58.4%
Bolivians
99.6
/100
|
#73
Exceptional
58.3%
Immigrants from Afghanistan
99.6
/100
|
#74
Exceptional
58.3%
Poles
99.5
/100
|
#75
Exceptional
58.3%
Creek
99.5
/100
|
#76
Exceptional
58.3%
Slovenes
99.5
/100
|
#77
Exceptional
58.3%
Lithuanians
99.5
/100
|
#78
Exceptional
58.2%
Delaware
99.4
/100
|
#79
Exceptional
58.2%

Austrian 2 or more Vehicles in Household Correlation Summary

MeasurementAustrian Data2 or more Vehicles in Household Data
Minimum0.17%27.3%
Maximum52.3%100.0%
Range52.2%72.7%
Mean15.4%68.8%
Median12.7%66.8%
Interquartile 25% (IQ1)6.0%59.2%
Interquartile 75% (IQ3)22.0%75.7%
Interquartile Range (IQR)16.0%16.5%
Standard Deviation (Sample)11.9%16.5%
Standard Deviation (Population)11.8%16.3%

Correlation Details

Austrian PercentileSample Size2 or more Vehicles in Household
[
0.0%
-
0.5%
]
0.17%
406,405,00757.2%
[
0.5%
-
1.0%
]
0.67%
36,509,63359.6%
[
1.0%
-
1.5%
]
1.20%
6,151,07661.2%
[
1.5%
-
2.0%
]
1.70%
1,579,82461.0%
[
2.0%
-
2.5%
]
2.20%
471,03863.8%
[
2.5%
-
3.0%
]
2.70%
274,76266.2%
[
3.0%
-
3.5%
]
3.20%
143,69760.5%
[
3.5%
-
4.0%
]
3.71%
106,13170.5%
[
4.0%
-
4.5%
]
4.18%
73,99763.3%
[
4.5%
-
5.0%
]
4.79%
28,77964.7%
[
5.0%
-
5.5%
]
5.23%
18,94166.4%
[
5.5%
-
6.0%
]
5.77%
12,23568.8%
[
6.0%
-
6.5%
]
6.26%
13,87557.2%
[
6.5%
-
7.0%
]
6.74%
7,98174.2%
[
7.0%
-
7.5%
]
7.28%
10,68169.8%
[
7.5%
-
8.0%
]
7.78%
7,97866.8%
[
8.0%
-
8.5%
]
8.27%
1,29458.8%
[
8.5%
-
9.0%
]
8.78%
3,41871.3%
[
9.0%
-
9.5%
]
9.26%
1,49175.2%
[
9.5%
-
10.0%
]
9.63%
4,32283.4%
[
10.0%
-
10.5%
]
10.20%
3,77467.5%
[
10.5%
-
11.0%
]
10.89%
3,76570.9%
[
11.0%
-
11.5%
]
11.19%
1,17157.4%
[
12.0%
-
12.5%
]
12.22%
1,05667.6%
[
12.5%
-
13.0%
]
12.68%
5,99366.2%
[
13.0%
-
13.5%
]
13.28%
58066.1%
[
13.5%
-
14.0%
]
13.68%
11766.7%
[
14.5%
-
15.0%
]
14.84%
1,29473.7%
[
15.0%
-
15.5%
]
15.15%
9936.5%
[
16.0%
-
16.5%
]
16.38%
2,80256.2%
[
16.5%
-
17.0%
]
16.67%
12100.0%
[
17.5%
-
18.0%
]
17.88%
17976.5%
[
18.0%
-
18.5%
]
18.14%
39749.5%
[
18.5%
-
19.0%
]
18.83%
37740.2%
[
19.0%
-
19.5%
]
19.33%
50743.2%
[
20.5%
-
21.0%
]
20.81%
62072.8%
[
21.5%
-
22.0%
]
21.74%
46100.0%
[
22.0%
-
22.5%
]
22.22%
7281.8%
[
23.5%
-
24.0%
]
23.95%
52677.3%
[
26.0%
-
26.5%
]
26.04%
19289.6%
[
26.5%
-
27.0%
]
26.84%
65276.2%
[
27.5%
-
28.0%
]
27.59%
29100.0%
[
29.5%
-
30.0%
]
29.70%
10127.3%
[
33.0%
-
33.5%
]
33.33%
10875.0%
[
34.0%
-
34.5%
]
34.38%
32100.0%
[
34.5%
-
35.0%
]
34.78%
2353.3%
[
36.5%
-
37.0%
]
36.84%
19100.0%
[
41.0%
-
41.5%
]
41.40%
285100.0%
[
52.0%
-
52.5%
]
52.33%
8657.7%