Austrian Unemployment Among Women with Children Ages 6 to 17 years
COMPARE
Austrian
Select to Compare
Unemployment Among Women with Children Ages 6 to 17 years
Austrian Unemployment Among Women with Children Ages 6 to 17 years
9.1%
UNEMPLOYMENT | WOMEN W/ CHILDREN 6 TO 17
25.0/ 100
METRIC RATING
195th/ 347
METRIC RANK
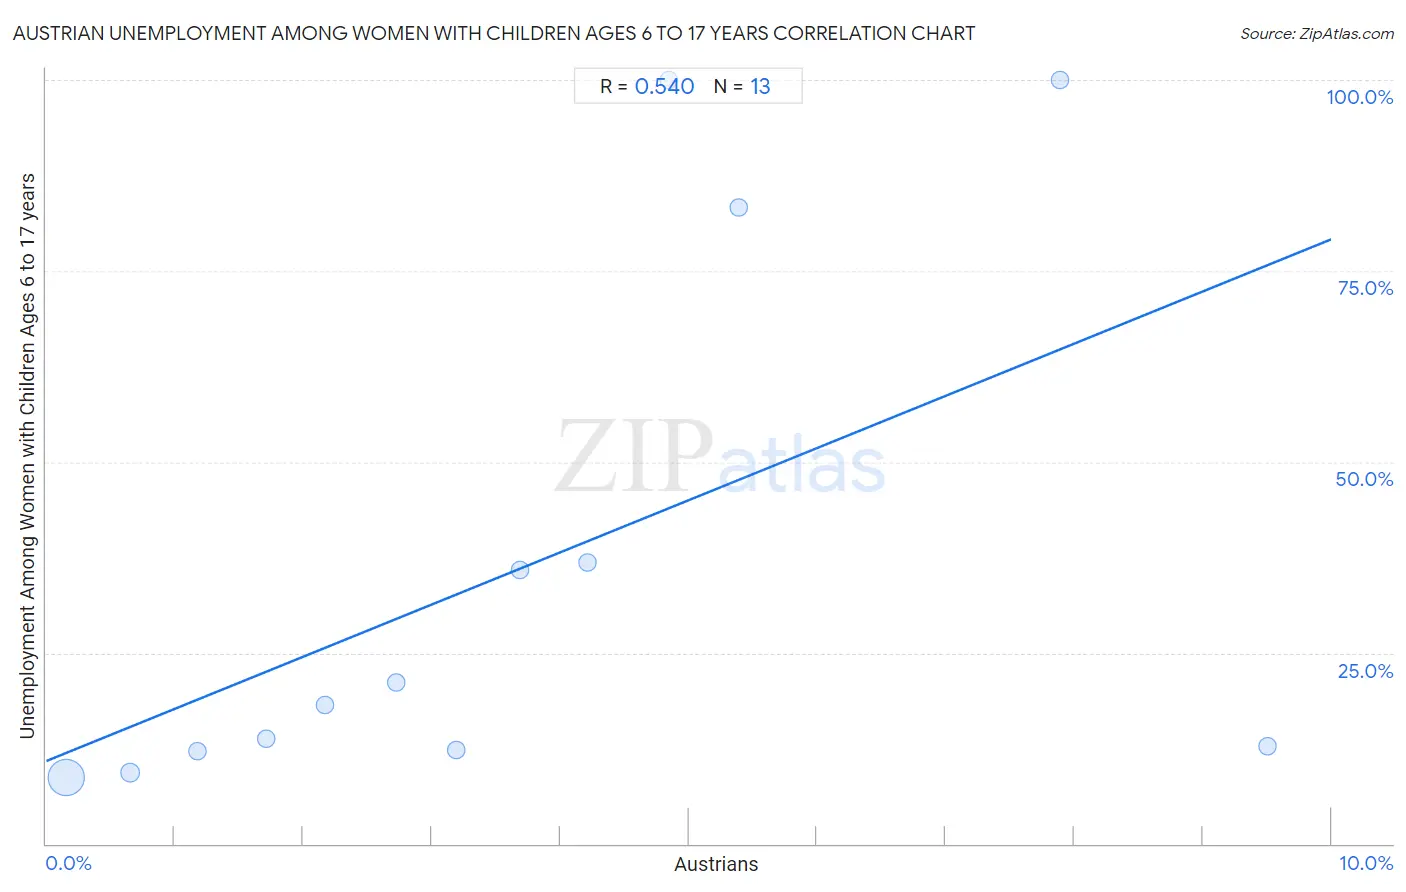
Austrian Unemployment Among Women with Children Ages 6 to 17 years Correlation Chart
The statistical analysis conducted on geographies consisting of 303,706,966 people shows a substantial positive correlation between the proportion of Austrians and unemployment rate among women with children between the ages 6 and 17 in the United States with a correlation coefficient (R) of 0.540 and weighted average of 9.1%. On average, for every 1% (one percent) increase in Austrians within a typical geography, there is an increase of 6.8% in unemployment rate among women with children between the ages 6 and 17.
It is essential to understand that the correlation between the percentage of Austrians and unemployment rate among women with children between the ages 6 and 17 does not imply a direct cause-and-effect relationship. It remains uncertain whether the presence of Austrians influences an upward or downward trend in the level of unemployment rate among women with children between the ages 6 and 17 within an area, or if Austrians simply ended up residing in those areas with higher or lower levels of unemployment rate among women with children between the ages 6 and 17 due to other factors.
Demographics Similar to Austrians by Unemployment Among Women with Children Ages 6 to 17 years
In terms of unemployment among women with children ages 6 to 17 years, the demographic groups most similar to Austrians are Immigrants from Kazakhstan (9.1%, a difference of 0.020%), Brazilian (9.1%, a difference of 0.030%), Immigrants from Panama (9.1%, a difference of 0.040%), Immigrants from Turkey (9.1%, a difference of 0.050%), and Guamanian/Chamorro (9.1%, a difference of 0.13%).
| Demographics | Rating | Rank | Unemployment Among Women with Children Ages 6 to 17 years |
| Immigrants from Syria | 29.7 /100 | #188 | Fair 9.1% |
| Immigrants | 29.2 /100 | #189 | Fair 9.1% |
| Slovenes | 28.5 /100 | #190 | Fair 9.1% |
| Belizeans | 28.4 /100 | #191 | Fair 9.1% |
| Guamanians/Chamorros | 27.2 /100 | #192 | Fair 9.1% |
| Immigrants from Turkey | 25.8 /100 | #193 | Fair 9.1% |
| Immigrants from Kazakhstan | 25.3 /100 | #194 | Fair 9.1% |
| Austrians | 25.0 /100 | #195 | Fair 9.1% |
| Brazilians | 24.4 /100 | #196 | Fair 9.1% |
| Immigrants from Panama | 24.3 /100 | #197 | Fair 9.1% |
| Guyanese | 21.8 /100 | #198 | Fair 9.1% |
| Czechoslovakians | 20.8 /100 | #199 | Fair 9.1% |
| Trinidadians and Tobagonians | 18.2 /100 | #200 | Poor 9.1% |
| Immigrants from Trinidad and Tobago | 16.7 /100 | #201 | Poor 9.1% |
| Immigrants from Middle Africa | 15.6 /100 | #202 | Poor 9.1% |
Austrian Unemployment Among Women with Children Ages 6 to 17 years Correlation Summary
| Measurement | Austrian Data | Unemployment Among Women with Children Ages 6 to 17 years Data |
| Minimum | 0.16% | 8.6% |
| Maximum | 9.5% | 100.0% |
| Range | 9.3% | 91.4% |
| Mean | 3.6% | 35.7% |
| Median | 3.2% | 18.2% |
| Interquartile 25% (IQ1) | 1.4% | 12.1% |
| Interquartile 75% (IQ3) | 5.1% | 60.1% |
| Interquartile Range (IQR) | 3.7% | 48.0% |
| Standard Deviation (Sample) | 2.8% | 34.9% |
| Standard Deviation (Population) | 2.7% | 33.5% |
Correlation Details
| Austrian Percentile | Sample Size | Unemployment Among Women with Children Ages 6 to 17 years |
[ 0.0% - 0.5% ] 0.16% | 286,286,153 | 8.6% |
[ 0.5% - 1.0% ] 0.65% | 15,176,258 | 9.3% |
[ 1.0% - 1.5% ] 1.18% | 1,694,048 | 12.0% |
[ 1.5% - 2.0% ] 1.71% | 394,928 | 13.7% |
[ 2.0% - 2.5% ] 2.17% | 71,770 | 18.2% |
[ 2.5% - 3.0% ] 2.72% | 26,607 | 21.1% |
[ 3.0% - 3.5% ] 3.19% | 18,094 | 12.2% |
[ 3.5% - 4.0% ] 3.69% | 11,920 | 35.8% |
[ 4.0% - 4.5% ] 4.21% | 21,351 | 36.9% |
[ 4.5% - 5.0% ] 4.85% | 1,176 | 100.0% |
[ 5.0% - 5.5% ] 5.39% | 853 | 83.4% |
[ 7.5% - 8.0% ] 7.89% | 1,420 | 100.0% |
[ 9.5% - 10.0% ] 9.51% | 2,388 | 12.8% |