Austrian College, 1 year or more

COMPARE

Austrian
Race
Ancestry
AfghanAfricanAlaska NativeAlaskan AthabascanAlbanianAleutAlsatianAmericanApacheArabArapahoArgentineanArmenianAssyrian/Chaldean/SyriacAustralianAustrianBahamianBangladeshiBarbadianBasqueBelgianBelizeanBermudanBhutaneseBlackfeetBolivianBrazilianBritishBritish West IndianBulgarianBurmeseCajunCambodianCanadianCape VerdeanCarpatho RusynCelticCentral AmericanCentral American IndianCherokeeCheyenneChickasawChileanChineseChippewaChoctawColombianColvilleComancheCosta RicanCreeCreekCroatianCrowCubanCypriotCzechCzechoslovakianDanishDelawareDominicanDutchDutch West IndianEastern EuropeanEcuadorianEgyptianEnglishEstonianEthiopianEuropeanFijianFilipinoFinnishFrenchFrench American IndianFrench CanadianGermanGerman RussianGhanaianGreekGuamanian/ChamorroGuatemalanGuyaneseHaitianHmongHonduranHopiHoumaHungarianIcelanderIndian (Asian)IndonesianInupiatIranianIraqiIrishIroquoisIsraeliItalianJamaicanJapaneseJordanianKenyanKiowaKoreanLaotianLatvianLebaneseLiberianLithuanianLumbeeLuxembourgerMacedonianMalaysianMalteseMarshalleseMenomineeMexicanMexican American IndianMongolianMoroccanNative HawaiianNavajoNepaleseNew ZealanderNicaraguanNigerianNorthern EuropeanNorwegianOkinawanOsageOttawaPaiutePakistaniPalestinianPanamanianParaguayanPennsylvania GermanPeruvianPimaPolishPortuguesePotawatomiPuebloPuerto RicanPuget Sound SalishRomanianRussianSalvadoranSamoanScandinavianScotch-IrishScottishSeminoleSenegaleseSerbianShoshoneSierra LeoneanSiouxSlavicSlovakSloveneSomaliSouth AfricanSouth AmericanSouth American IndianSoviet UnionSpaniardSpanishSpanish AmericanSpanish American IndianSri LankanSubsaharan AfricanSudaneseSwedishSwissSyrianTaiwaneseThaiTlingit-HaidaTohono O'OdhamTonganTrinidadian and TobagonianTsimshianTurkishU.S. Virgin IslanderUgandanUkrainianUruguayanUteVenezuelanVietnameseWelshWest IndianYakamaYaquiYugoslavianYumanYup'ikZimbabwean
Immigration
NonimmigrantsImmigrantsAfghanistanAfricaAlbaniaArgentinaArmeniaAsiaAustraliaAustriaBahamasBangladeshBarbadosBelarusBelgiumBelizeBoliviaBosnia and HerzegovinaBrazilBulgariaBurma/MyanmarCabo VerdeCambodiaCameroonCanadaCaribbeanCentral AmericaChileChinaColombiaCongoCosta RicaCroatiaCubaCzechoslovakiaDenmarkDominicaDominican RepublicEastern AfricaEastern AsiaEastern EuropeEcuadorEgyptEl SalvadorEnglandEritreaEthiopiaEuropeFijiFranceGermanyGhanaGreeceGrenadaGuatemalaGuyanaHaitiHondurasHong KongHungaryIndiaIndonesiaIranIraqIrelandIsraelItalyJamaicaJapanJordanKazakhstanKenyaKoreaKuwaitLaosLatin AmericaLatviaLebanonLiberiaLithuaniaMalaysiaMexicoMicronesiaMiddle AfricaMoldovaMoroccoNepalNetherlandsNicaraguaNigeriaNorth AmericaNorth MacedoniaNorthern AfricaNorthern EuropeNorwayOceaniaPakistanPanamaPeruPhilippinesPolandPortugalRomaniaRussiaSaudi ArabiaScotlandSenegalSerbiaSierra LeoneSingaporeSomaliaSouth AfricaSouth AmericaSouth Central AsiaSouth Eastern AsiaSouthern EuropeSpainSri LankaSt. Vincent and the GrenadinesSudanSwedenSwitzerlandSyriaTaiwanThailandTrinidad and TobagoTurkeyUgandaUkraineUruguayUzbekistanVenezuelaVietnamWest IndiesWestern AfricaWestern AsiaWestern EuropeYemenZaireZimbabweAzores
Select to Compare
Race
Ancestry
AfghanAfricanAlaska NativeAlaskan AthabascanAlbanianAleutAlsatianAmericanApacheArabArapahoArgentineanArmenianAssyrian/Chaldean/SyriacAustralianBahamianBangladeshiBarbadianBasqueBelgianBelizeanBermudanBhutaneseBlackfeetBolivianBrazilianBritishBritish West IndianBulgarianBurmeseCajunCambodianCanadianCape VerdeanCarpatho RusynCelticCentral AmericanCentral American IndianCherokeeCheyenneChickasawChileanChineseChippewaChoctawColombianColvilleComancheCosta RicanCreeCreekCroatianCrowCubanCypriotCzechCzechoslovakianDanishDelawareDominicanDutchDutch West IndianEastern EuropeanEcuadorianEgyptianEnglishEstonianEthiopianEuropeanFijianFilipinoFinnishFrenchFrench American IndianFrench CanadianGermanGerman RussianGhanaianGreekGuamanian/ChamorroGuatemalanGuyaneseHaitianHmongHonduranHopiHoumaHungarianIcelanderIndian (Asian)IndonesianInupiatIranianIraqiIrishIroquoisIsraeliItalianJamaicanJapaneseJordanianKenyanKiowaKoreanLaotianLatvianLebaneseLiberianLithuanianLumbeeLuxembourgerMacedonianMalaysianMalteseMarshalleseMenomineeMexicanMexican American IndianMongolianMoroccanNative HawaiianNavajoNepaleseNew ZealanderNicaraguanNigerianNorthern EuropeanNorwegianOkinawanOsageOttawaPaiutePakistaniPalestinianPanamanianParaguayanPennsylvania GermanPeruvianPimaPolishPortuguesePotawatomiPuebloPuerto RicanPuget Sound SalishRomanianRussianSalvadoranSamoanScandinavianScotch-IrishScottishSeminoleSenegaleseSerbianShoshoneSierra LeoneanSiouxSlavicSlovakSloveneSomaliSouth AfricanSouth AmericanSouth American IndianSoviet UnionSpaniardSpanishSpanish AmericanSpanish American IndianSri LankanSubsaharan AfricanSudaneseSwedishSwissSyrianTaiwaneseThaiTlingit-HaidaTohono O'OdhamTonganTrinidadian and TobagonianTsimshianTurkishU.S. Virgin IslanderUgandanUkrainianUruguayanUteVenezuelanVietnameseWelshWest IndianYakamaYaquiYugoslavianYumanYup'ikZimbabwean
Immigration
NonimmigrantsImmigrantsAfghanistanAfricaAlbaniaArgentinaArmeniaAsiaAustraliaAustriaBahamasBangladeshBarbadosBelarusBelgiumBelizeBoliviaBosnia and HerzegovinaBrazilBulgariaBurma/MyanmarCabo VerdeCambodiaCameroonCanadaCaribbeanCentral AmericaChileChinaColombiaCongoCosta RicaCroatiaCubaCzechoslovakiaDenmarkDominicaDominican RepublicEastern AfricaEastern AsiaEastern EuropeEcuadorEgyptEl SalvadorEnglandEritreaEthiopiaEuropeFijiFranceGermanyGhanaGreeceGrenadaGuatemalaGuyanaHaitiHondurasHong KongHungaryIndiaIndonesiaIranIraqIrelandIsraelItalyJamaicaJapanJordanKazakhstanKenyaKoreaKuwaitLaosLatin AmericaLatviaLebanonLiberiaLithuaniaMalaysiaMexicoMicronesiaMiddle AfricaMoldovaMoroccoNepalNetherlandsNicaraguaNigeriaNorth AmericaNorth MacedoniaNorthern AfricaNorthern EuropeNorwayOceaniaPakistanPanamaPeruPhilippinesPolandPortugalRomaniaRussiaSaudi ArabiaScotlandSenegalSerbiaSierra LeoneSingaporeSomaliaSouth AfricaSouth AmericaSouth Central AsiaSouth Eastern AsiaSouthern EuropeSpainSri LankaSt. Vincent and the GrenadinesSudanSwedenSwitzerlandSyriaTaiwanThailandTrinidad and TobagoTurkeyUgandaUkraineUruguayUzbekistanVenezuelaVietnamWest IndiesWestern AfricaWestern AsiaWestern EuropeYemenZaireZimbabweAzores
College, 1 year or more
Income
Poverty
Unemployment
Labor Participation
Family Structure
Vehicle Availability
Education Level
Disability

Austrian College, 1 year or more
Exceptional

61.8%
COLLEGE, 1 YEAR OR MORE
95.4/ 100
METRIC RATING
112th/ 347
METRIC RANK

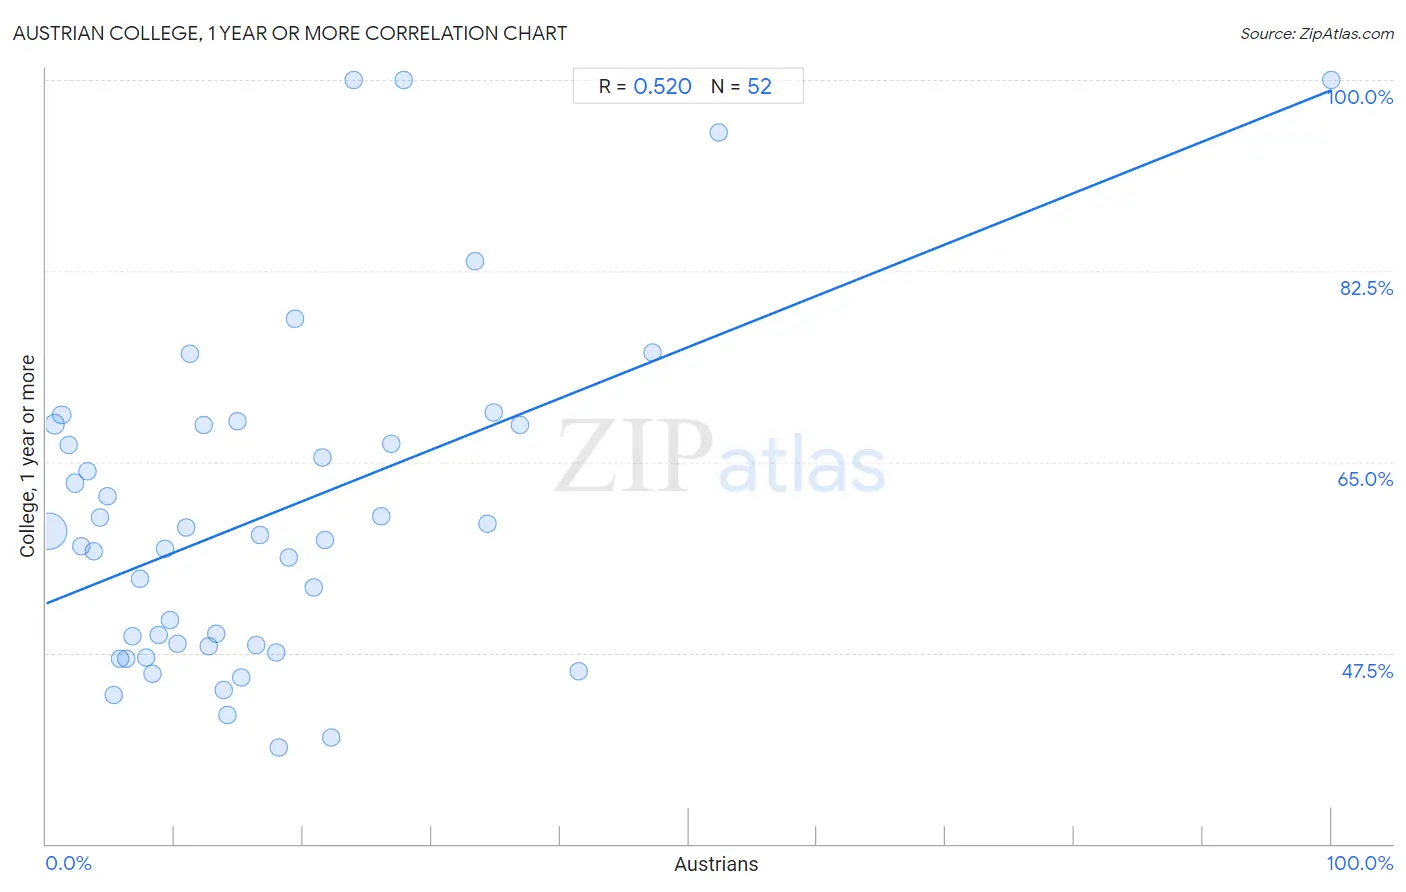
Austrian College, 1 year or more Correlation Chart

The statistical analysis conducted on geographies consisting of 452,079,126 people shows a substantial positive correlation between the proportion of Austrians and percentage of population with at least college, 1 year or more education in the United States with a correlation coefficient (R) of 0.520 and weighted average of 61.8%. On average, for every 1% (one percent) increase in Austrians within a typical geography, there is an increase of 0.47% in percentage of population with at least college, 1 year or more education.
Austrian College, 1 year or more
It is essential to understand that the correlation between the percentage of Austrians and percentage of population with at least college, 1 year or more education does not imply a direct cause-and-effect relationship. It remains uncertain whether the presence of Austrians influences an upward or downward trend in the level of percentage of population with at least college, 1 year or more education within an area, or if Austrians simply ended up residing in those areas with higher or lower levels of percentage of population with at least college, 1 year or more education due to other factors.

Demographics Similar to Austrians by College, 1 year or more

In terms of college, 1 year or more, the demographic groups most similar to Austrians are European (61.8%, a difference of 0.060%), Macedonian (61.8%, a difference of 0.060%), Ukrainian (61.8%, a difference of 0.070%), Syrian (61.9%, a difference of 0.080%), and Immigrants from Northern Africa (61.9%, a difference of 0.080%).
DemographicsRating | RankCollege, 1 year or more
Immigrants from Nepal
96.3
/100
|
#105
Exceptional
62.0%
Palestinians
96.3
/100
|
#106
Exceptional
62.0%
Immigrants from Ukraine
95.8
/100
|
#107
Exceptional
61.9%
Syrians
95.7
/100
|
#108
Exceptional
61.9%
Immigrants from Northern Africa
95.7
/100
|
#109
Exceptional
61.9%
Europeans
95.6
/100
|
#110
Exceptional
61.8%
Macedonians
95.6
/100
|
#111
Exceptional
61.8%
Austrians
95.4
/100
|
#112
Exceptional
61.8%
Ukrainians
95.2
/100
|
#113
Exceptional
61.8%
Danes
94.8
/100
|
#114
Exceptional
61.7%
Norwegians
94.5
/100
|
#115
Exceptional
61.7%
Lebanese
94.1
/100
|
#116
Exceptional
61.6%
Arabs
93.9
/100
|
#117
Exceptional
61.6%
Immigrants from Brazil
93.9
/100
|
#118
Exceptional
61.6%
Assyrians/Chaldeans/Syriacs
93.3
/100
|
#119
Exceptional
61.5%

Austrian College, 1 year or more Correlation Summary

MeasurementAustrian DataCollege, 1 year or more Data
Minimum0.17%38.8%
Maximum100.0%100.0%
Range99.8%61.2%
Mean17.4%60.2%
Median13.5%58.1%
Interquartile 25% (IQ1)6.5%48.1%
Interquartile 75% (IQ3)22.0%68.4%
Interquartile Range (IQR)15.5%20.3%
Standard Deviation (Sample)16.9%15.3%
Standard Deviation (Population)16.8%15.2%

Correlation Details

Austrian PercentileSample SizeCollege, 1 year or more
[
0.0%
-
0.5%
]
0.17%
406,560,29258.7%
[
0.5%
-
1.0%
]
0.67%
36,566,07568.4%
[
1.0%
-
1.5%
]
1.20%
6,162,89169.3%
[
1.5%
-
2.0%
]
1.70%
1,580,48066.6%
[
2.0%
-
2.5%
]
2.20%
471,03863.1%
[
2.5%
-
3.0%
]
2.70%
276,26857.3%
[
3.0%
-
3.5%
]
3.20%
143,69764.1%
[
3.5%
-
4.0%
]
3.71%
107,71956.9%
[
4.0%
-
4.5%
]
4.18%
73,99759.9%
[
4.5%
-
5.0%
]
4.79%
28,77961.8%
[
5.0%
-
5.5%
]
5.23%
19,05843.7%
[
5.5%
-
6.0%
]
5.77%
12,23547.0%
[
6.0%
-
6.5%
]
6.26%
13,87546.9%
[
6.5%
-
7.0%
]
6.74%
7,98149.0%
[
7.0%
-
7.5%
]
7.28%
10,68154.2%
[
7.5%
-
8.0%
]
7.78%
7,97847.1%
[
8.0%
-
8.5%
]
8.27%
1,29445.6%
[
8.5%
-
9.0%
]
8.78%
3,41849.1%
[
9.0%
-
9.5%
]
9.26%
1,49157.0%
[
9.5%
-
10.0%
]
9.63%
4,32250.5%
[
10.0%
-
10.5%
]
10.20%
3,89148.3%
[
10.5%
-
11.0%
]
10.89%
3,76559.0%
[
11.0%
-
11.5%
]
11.19%
1,17174.9%
[
12.0%
-
12.5%
]
12.22%
1,05668.4%
[
12.5%
-
13.0%
]
12.68%
5,99348.0%
[
13.0%
-
13.5%
]
13.28%
58049.3%
[
13.5%
-
14.0%
]
13.78%
19644.1%
[
14.0%
-
14.5%
]
14.06%
31341.9%
[
14.5%
-
15.0%
]
14.84%
1,29468.7%
[
15.0%
-
15.5%
]
15.15%
9945.2%
[
16.0%
-
16.5%
]
16.38%
2,80248.2%
[
16.5%
-
17.0%
]
16.67%
1258.3%
[
17.5%
-
18.0%
]
17.88%
17947.6%
[
18.0%
-
18.5%
]
18.14%
39738.8%
[
18.5%
-
19.0%
]
18.83%
37756.2%
[
19.0%
-
19.5%
]
19.33%
50778.1%
[
20.5%
-
21.0%
]
20.81%
62053.5%
[
21.0%
-
21.5%
]
21.50%
10765.4%
[
21.5%
-
22.0%
]
21.74%
4657.9%
[
22.0%
-
22.5%
]
22.22%
7239.7%
[
23.5%
-
24.0%
]
23.95%
526100.0%
[
26.0%
-
26.5%
]
26.04%
19260.0%
[
26.5%
-
27.0%
]
26.84%
65266.7%
[
27.5%
-
28.0%
]
27.84%
97100.0%
[
33.0%
-
33.5%
]
33.33%
10883.3%
[
34.0%
-
34.5%
]
34.38%
3259.4%
[
34.5%
-
35.0%
]
34.78%
2369.6%
[
36.5%
-
37.0%
]
36.84%
1968.4%
[
41.0%
-
41.5%
]
41.40%
28545.8%
[
47.0%
-
47.5%
]
47.22%
3675.0%
[
52.0%
-
52.5%
]
52.33%
8695.2%
[
99.5%
-
100.0%
]
100.00%
24100.0%