Austrian Disability Age Under 5
COMPARE
Austrian
Select to Compare
Disability Age Under 5
Austrian Disability Age Under 5
1.4%
DISABILITY | AGE UNDER 5
0.1/ 100
METRIC RATING
269th/ 347
METRIC RANK
Austrian Disability Age Under 5 Correlation Chart
The statistical analysis conducted on geographies consisting of 227,811,367 people shows a poor positive correlation between the proportion of Austrians and percentage of population with a disability under the age of 5 in the United States with a correlation coefficient (R) of 0.171 and weighted average of 1.4%. On average, for every 1% (one percent) increase in Austrians within a typical geography, there is an increase of 0.49% in percentage of population with a disability under the age of 5.
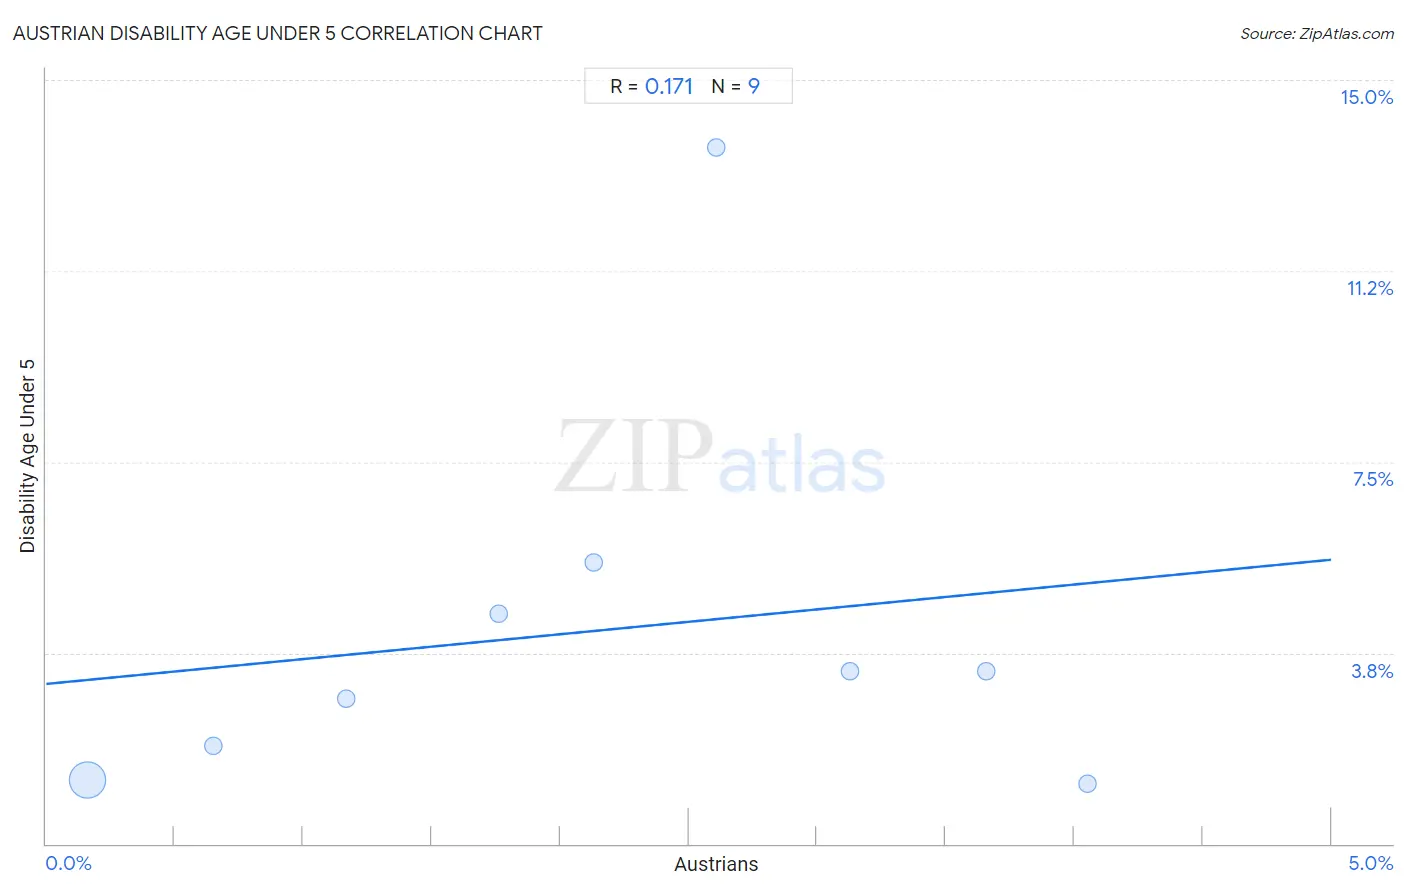
It is essential to understand that the correlation between the percentage of Austrians and percentage of population with a disability under the age of 5 does not imply a direct cause-and-effect relationship. It remains uncertain whether the presence of Austrians influences an upward or downward trend in the level of percentage of population with a disability under the age of 5 within an area, or if Austrians simply ended up residing in those areas with higher or lower levels of percentage of population with a disability under the age of 5 due to other factors.
Demographics Similar to Austrians by Disability Age Under 5
In terms of disability age under 5, the demographic groups most similar to Austrians are Immigrants from North America (1.4%, a difference of 0.13%), Immigrants from Canada (1.4%, a difference of 0.17%), Belgian (1.4%, a difference of 0.18%), Black/African American (1.4%, a difference of 0.33%), and Alaskan Athabascan (1.5%, a difference of 0.63%).
| Demographics | Rating | Rank | Disability Age Under 5 |
| Immigrants from Dominica | 0.2 /100 | #262 | Tragic 1.4% |
| Spanish | 0.2 /100 | #263 | Tragic 1.4% |
| Yugoslavians | 0.1 /100 | #264 | Tragic 1.4% |
| Carpatho Rusyns | 0.1 /100 | #265 | Tragic 1.4% |
| Immigrants from Germany | 0.1 /100 | #266 | Tragic 1.4% |
| Cree | 0.1 /100 | #267 | Tragic 1.4% |
| Belgians | 0.1 /100 | #268 | Tragic 1.4% |
| Austrians | 0.1 /100 | #269 | Tragic 1.4% |
| Immigrants from North America | 0.1 /100 | #270 | Tragic 1.4% |
| Immigrants from Canada | 0.1 /100 | #271 | Tragic 1.4% |
| Blacks/African Americans | 0.1 /100 | #272 | Tragic 1.4% |
| Alaskan Athabascans | 0.1 /100 | #273 | Tragic 1.5% |
| Iroquois | 0.0 /100 | #274 | Tragic 1.5% |
| Brazilians | 0.0 /100 | #275 | Tragic 1.5% |
| Greeks | 0.0 /100 | #276 | Tragic 1.5% |
Austrian Disability Age Under 5 Correlation Summary
| Measurement | Austrian Data | Disability Age Under 5 Data |
| Minimum | 0.16% | 1.2% |
| Maximum | 4.1% | 13.7% |
| Range | 3.9% | 12.5% |
| Mean | 2.1% | 4.2% |
| Median | 2.1% | 3.4% |
| Interquartile 25% (IQ1) | 0.91% | 1.6% |
| Interquartile 75% (IQ3) | 3.4% | 5.0% |
| Interquartile Range (IQR) | 2.5% | 3.4% |
| Standard Deviation (Sample) | 1.3% | 3.8% |
| Standard Deviation (Population) | 1.3% | 3.6% |
Correlation Details
| Austrian Percentile | Sample Size | Disability Age Under 5 |
[ 0.0% - 0.5% ] 0.16% | 217,326,838 | 1.3% |
[ 0.5% - 1.0% ] 0.65% | 9,257,047 | 1.9% |
[ 1.0% - 1.5% ] 1.17% | 910,146 | 2.8% |
[ 1.5% - 2.0% ] 1.76% | 261,131 | 4.5% |
[ 2.0% - 2.5% ] 2.13% | 13,345 | 5.5% |
[ 2.5% - 3.0% ] 2.61% | 11,014 | 13.7% |
[ 3.0% - 3.5% ] 3.13% | 12,179 | 3.4% |
[ 3.5% - 4.0% ] 3.66% | 11,372 | 3.4% |
[ 4.0% - 4.5% ] 4.05% | 8,295 | 1.2% |