Austrian Receiving Food Stamps
COMPARE
Austrian
Select to Compare
Receiving Food Stamps
Austrian Receiving Food Stamps
10.0%
PUBLIC INCOME | FOOD STAMPS
98.6/ 100
METRIC RATING
82nd/ 347
METRIC RANK
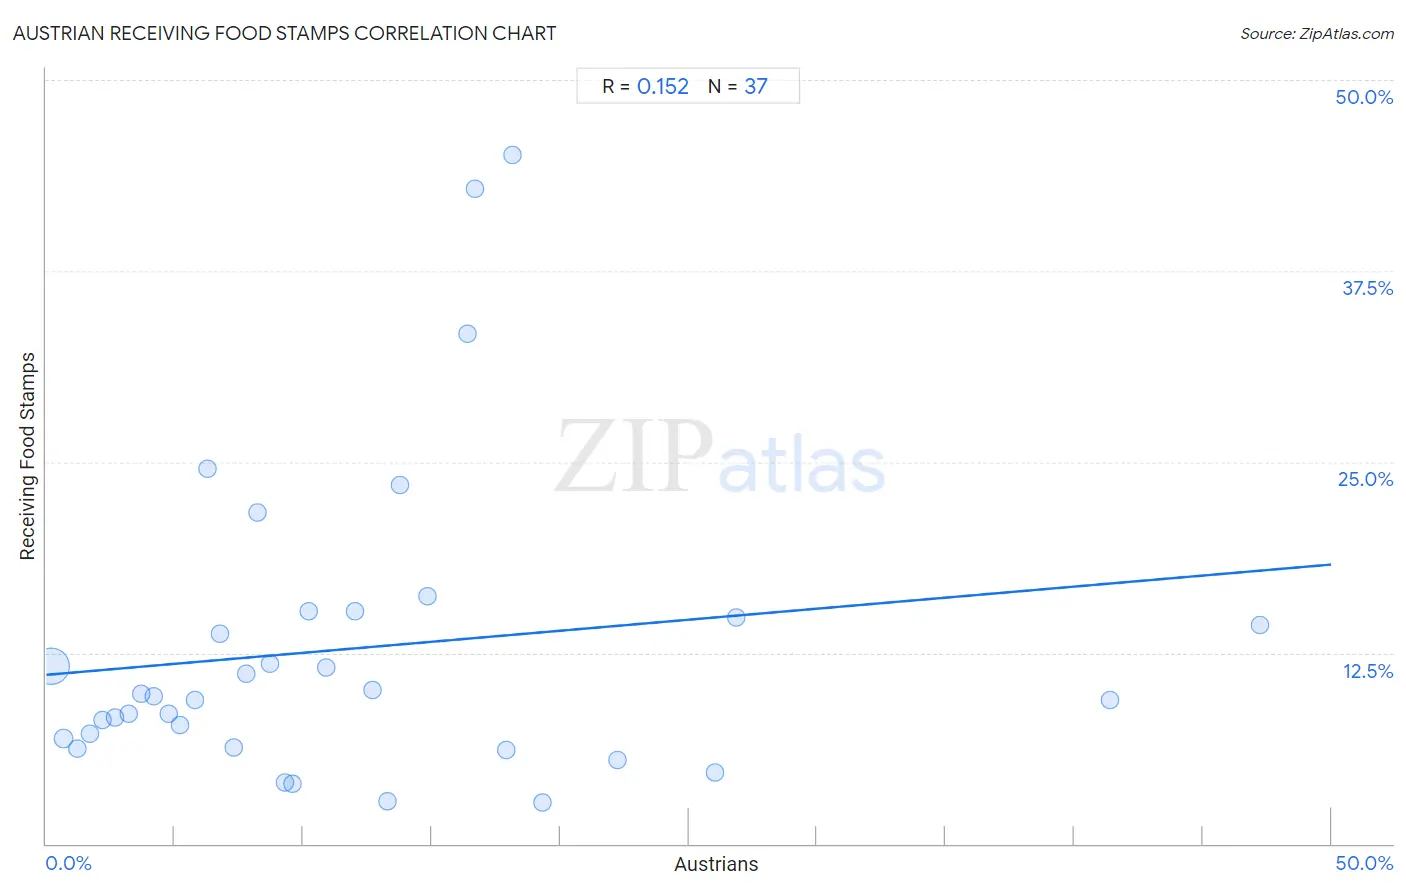
Austrian Receiving Food Stamps Correlation Chart
The statistical analysis conducted on geographies consisting of 450,225,937 people shows a poor positive correlation between the proportion of Austrians and percentage of population receiving government assistance and/or food stamps in the United States with a correlation coefficient (R) of 0.152 and weighted average of 10.0%. On average, for every 1% (one percent) increase in Austrians within a typical geography, there is an increase of 0.14% in percentage of population receiving government assistance and/or food stamps.
It is essential to understand that the correlation between the percentage of Austrians and percentage of population receiving government assistance and/or food stamps does not imply a direct cause-and-effect relationship. It remains uncertain whether the presence of Austrians influences an upward or downward trend in the level of percentage of population receiving government assistance and/or food stamps within an area, or if Austrians simply ended up residing in those areas with higher or lower levels of percentage of population receiving government assistance and/or food stamps due to other factors.
Demographics Similar to Austrians by Receiving Food Stamps
In terms of receiving food stamps, the demographic groups most similar to Austrians are Dutch (10.0%, a difference of 0.0%), Immigrants from Israel (10.0%, a difference of 0.070%), Immigrants from England (10.0%, a difference of 0.13%), Immigrants from Romania (10.0%, a difference of 0.25%), and Polish (10.0%, a difference of 0.27%).
| Demographics | Rating | Rank | Receiving Food Stamps |
| Immigrants from Zimbabwe | 98.7 /100 | #75 | Exceptional 9.9% |
| Immigrants from Croatia | 98.7 /100 | #76 | Exceptional 10.0% |
| Immigrants from North Macedonia | 98.7 /100 | #77 | Exceptional 10.0% |
| South Africans | 98.7 /100 | #78 | Exceptional 10.0% |
| Laotians | 98.7 /100 | #79 | Exceptional 10.0% |
| Poles | 98.6 /100 | #80 | Exceptional 10.0% |
| Immigrants from England | 98.6 /100 | #81 | Exceptional 10.0% |
| Austrians | 98.6 /100 | #82 | Exceptional 10.0% |
| Dutch | 98.6 /100 | #83 | Exceptional 10.0% |
| Immigrants from Israel | 98.5 /100 | #84 | Exceptional 10.0% |
| Immigrants from Romania | 98.5 /100 | #85 | Exceptional 10.0% |
| Immigrants from Norway | 98.4 /100 | #86 | Exceptional 10.0% |
| Egyptians | 98.4 /100 | #87 | Exceptional 10.0% |
| Immigrants from Kuwait | 98.4 /100 | #88 | Exceptional 10.0% |
| Immigrants from France | 98.3 /100 | #89 | Exceptional 10.1% |
Austrian Receiving Food Stamps Correlation Summary
| Measurement | Austrian Data | Receiving Food Stamps Data |
| Minimum | 0.17% | 2.7% |
| Maximum | 47.2% | 45.1% |
| Range | 47.1% | 42.4% |
| Mean | 11.9% | 12.8% |
| Median | 9.3% | 9.7% |
| Interquartile 25% (IQ1) | 4.5% | 6.6% |
| Interquartile 75% (IQ3) | 16.5% | 15.0% |
| Interquartile Range (IQR) | 12.1% | 8.4% |
| Standard Deviation (Sample) | 10.5% | 10.0% |
| Standard Deviation (Population) | 10.4% | 9.8% |
Correlation Details
| Austrian Percentile | Sample Size | Receiving Food Stamps |
[ 0.0% - 0.5% ] 0.17% | 405,622,064 | 11.6% |
[ 0.5% - 1.0% ] 0.67% | 36,124,656 | 6.9% |
[ 1.0% - 1.5% ] 1.20% | 5,930,654 | 6.2% |
[ 1.5% - 2.0% ] 1.71% | 1,487,105 | 7.2% |
[ 2.0% - 2.5% ] 2.20% | 419,010 | 8.1% |
[ 2.5% - 3.0% ] 2.69% | 250,870 | 8.3% |
[ 3.0% - 3.5% ] 3.20% | 114,132 | 8.5% |
[ 3.5% - 4.0% ] 3.70% | 94,815 | 9.8% |
[ 4.0% - 4.5% ] 4.17% | 64,309 | 9.7% |
[ 4.5% - 5.0% ] 4.78% | 24,755 | 8.5% |
[ 5.0% - 5.5% ] 5.22% | 18,667 | 7.8% |
[ 5.5% - 6.0% ] 5.77% | 10,400 | 9.4% |
[ 6.0% - 6.5% ] 6.26% | 12,371 | 24.6% |
[ 6.5% - 7.0% ] 6.75% | 6,965 | 13.7% |
[ 7.0% - 7.5% ] 7.29% | 9,529 | 6.3% |
[ 7.5% - 8.0% ] 7.78% | 7,965 | 11.1% |
[ 8.0% - 8.5% ] 8.23% | 826 | 21.7% |
[ 8.5% - 9.0% ] 8.70% | 2,114 | 11.8% |
[ 9.0% - 9.5% ] 9.28% | 1,045 | 4.0% |
[ 9.5% - 10.0% ] 9.59% | 3,547 | 3.9% |
[ 10.0% - 10.5% ] 10.20% | 3,725 | 15.3% |
[ 10.5% - 11.0% ] 10.89% | 3,765 | 11.6% |
[ 12.0% - 12.5% ] 12.04% | 457 | 15.2% |
[ 12.5% - 13.0% ] 12.68% | 5,993 | 10.0% |
[ 13.0% - 13.5% ] 13.26% | 377 | 2.8% |
[ 13.5% - 14.0% ] 13.78% | 196 | 23.5% |
[ 14.5% - 15.0% ] 14.86% | 1,097 | 16.2% |
[ 16.0% - 16.5% ] 16.41% | 2,395 | 33.4% |
[ 16.5% - 17.0% ] 16.67% | 12 | 42.9% |
[ 17.5% - 18.0% ] 17.88% | 179 | 6.1% |
[ 18.0% - 18.5% ] 18.14% | 397 | 45.1% |
[ 19.0% - 19.5% ] 19.31% | 378 | 2.7% |
[ 22.0% - 22.5% ] 22.22% | 72 | 5.5% |
[ 26.0% - 26.5% ] 26.04% | 192 | 4.7% |
[ 26.5% - 27.0% ] 26.84% | 652 | 14.8% |
[ 41.0% - 41.5% ] 41.40% | 215 | 9.4% |
[ 47.0% - 47.5% ] 47.22% | 36 | 14.3% |