Yugoslavian Male Disability
COMPARE
Yugoslavian
Select to Compare
Male Disability
Yugoslavian Male Disability
11.9%
DISABILITY | MALES
1.2/ 100
METRIC RATING
238th/ 347
METRIC RANK
Yugoslavian Male Disability Correlation Chart
The statistical analysis conducted on geographies consisting of 285,684,891 people shows a weak positive correlation between the proportion of Yugoslavians and percentage of males with a disability in the United States with a correlation coefficient (R) of 0.261 and weighted average of 11.9%. On average, for every 1% (one percent) increase in Yugoslavians within a typical geography, there is an increase of 0.34% in percentage of males with a disability.
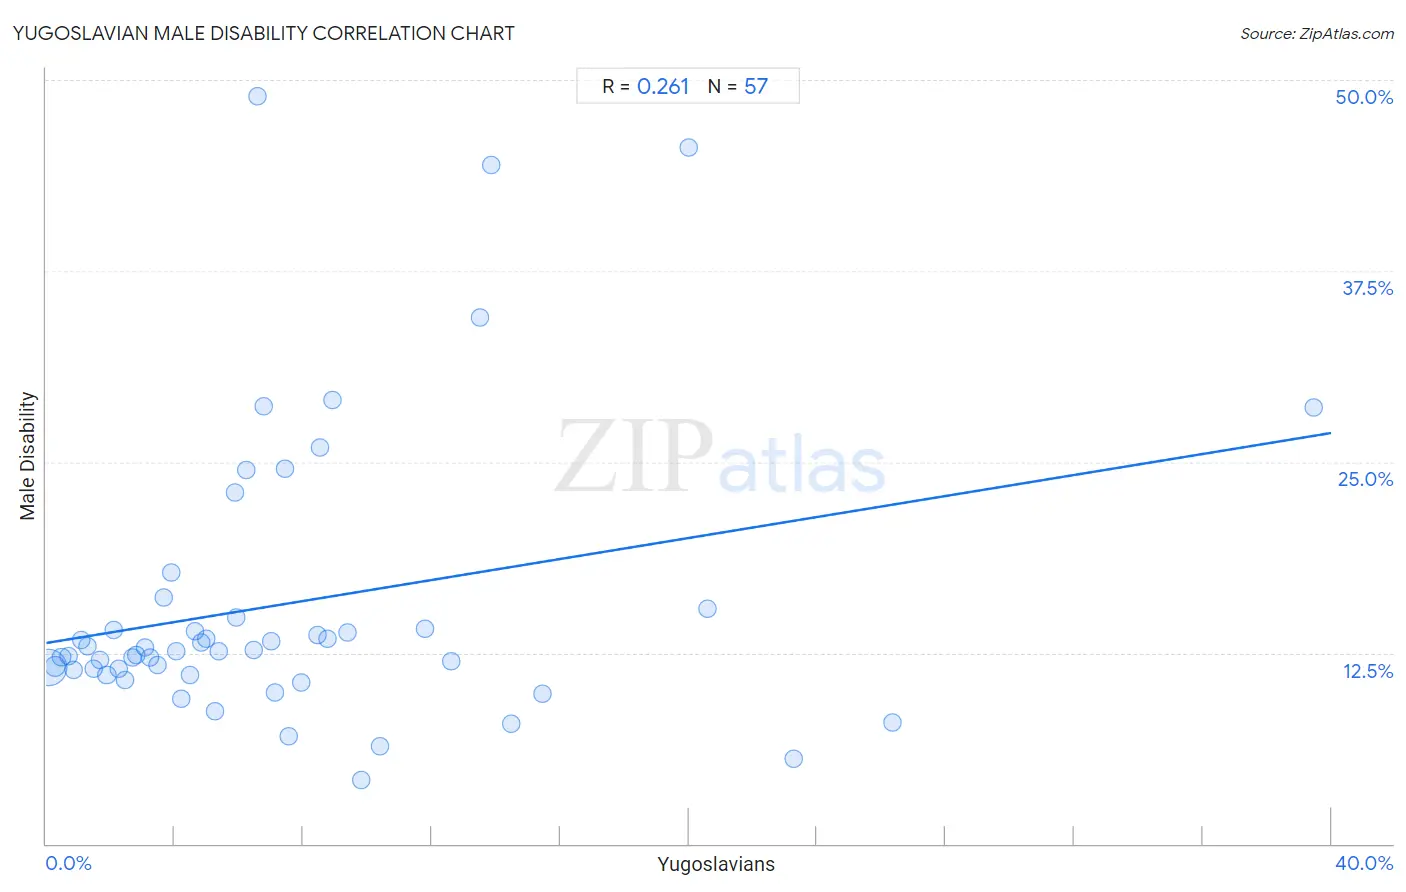
It is essential to understand that the correlation between the percentage of Yugoslavians and percentage of males with a disability does not imply a direct cause-and-effect relationship. It remains uncertain whether the presence of Yugoslavians influences an upward or downward trend in the level of percentage of males with a disability within an area, or if Yugoslavians simply ended up residing in those areas with higher or lower levels of percentage of males with a disability due to other factors.
Demographics Similar to Yugoslavians by Male Disability
In terms of male disability, the demographic groups most similar to Yugoslavians are Italian (11.9%, a difference of 0.050%), Carpatho Rusyn (11.9%, a difference of 0.10%), Czech (11.9%, a difference of 0.10%), U.S. Virgin Islander (11.9%, a difference of 0.11%), and Bahamian (11.9%, a difference of 0.14%).
| Demographics | Rating | Rank | Male Disability |
| Dominicans | 1.8 /100 | #231 | Tragic 11.8% |
| Malaysians | 1.8 /100 | #232 | Tragic 11.8% |
| Mexicans | 1.7 /100 | #233 | Tragic 11.8% |
| Immigrants from Canada | 1.6 /100 | #234 | Tragic 11.9% |
| Immigrants from North America | 1.5 /100 | #235 | Tragic 11.9% |
| U.S. Virgin Islanders | 1.3 /100 | #236 | Tragic 11.9% |
| Carpatho Rusyns | 1.3 /100 | #237 | Tragic 11.9% |
| Yugoslavians | 1.2 /100 | #238 | Tragic 11.9% |
| Italians | 1.2 /100 | #239 | Tragic 11.9% |
| Czechs | 1.1 /100 | #240 | Tragic 11.9% |
| Bahamians | 1.1 /100 | #241 | Tragic 11.9% |
| Northern Europeans | 1.1 /100 | #242 | Tragic 11.9% |
| Samoans | 1.1 /100 | #243 | Tragic 11.9% |
| Immigrants from Laos | 1.0 /100 | #244 | Tragic 11.9% |
| Immigrants from Liberia | 1.0 /100 | #245 | Tragic 11.9% |
Yugoslavian Male Disability Correlation Summary
| Measurement | Yugoslavian Data | Male Disability Data |
| Minimum | 0.060% | 4.2% |
| Maximum | 39.5% | 48.9% |
| Range | 39.4% | 44.8% |
| Mean | 7.5% | 15.7% |
| Median | 5.9% | 12.6% |
| Interquartile 25% (IQ1) | 2.7% | 11.2% |
| Interquartile 75% (IQ3) | 9.2% | 15.1% |
| Interquartile Range (IQR) | 6.4% | 3.9% |
| Standard Deviation (Sample) | 7.2% | 9.5% |
| Standard Deviation (Population) | 7.2% | 9.4% |
Correlation Details
| Yugoslavian Percentile | Sample Size | Male Disability |
[ 0.0% - 0.5% ] 0.060% | 239,045,795 | 11.5% |
[ 0.0% - 0.5% ] 0.28% | 27,877,402 | 11.6% |
[ 0.0% - 0.5% ] 0.48% | 8,626,373 | 12.2% |
[ 0.5% - 1.0% ] 0.69% | 3,570,912 | 12.3% |
[ 0.5% - 1.0% ] 0.87% | 2,194,573 | 11.4% |
[ 1.0% - 1.5% ] 1.08% | 1,093,165 | 13.4% |
[ 1.0% - 1.5% ] 1.26% | 751,105 | 12.9% |
[ 1.0% - 1.5% ] 1.47% | 391,529 | 11.5% |
[ 1.5% - 2.0% ] 1.66% | 389,348 | 12.1% |
[ 1.5% - 2.0% ] 1.89% | 373,881 | 11.0% |
[ 2.0% - 2.5% ] 2.09% | 269,257 | 14.0% |
[ 2.0% - 2.5% ] 2.24% | 195,748 | 11.5% |
[ 2.0% - 2.5% ] 2.47% | 116,196 | 10.7% |
[ 2.5% - 3.0% ] 2.68% | 164,492 | 12.2% |
[ 2.5% - 3.0% ] 2.79% | 44,297 | 12.4% |
[ 3.0% - 3.5% ] 3.06% | 28,373 | 12.9% |
[ 3.0% - 3.5% ] 3.22% | 51,003 | 12.2% |
[ 3.0% - 3.5% ] 3.45% | 85,120 | 11.7% |
[ 3.5% - 4.0% ] 3.67% | 5,070 | 16.1% |
[ 3.5% - 4.0% ] 3.88% | 8,180 | 17.8% |
[ 4.0% - 4.5% ] 4.05% | 11,563 | 12.6% |
[ 4.0% - 4.5% ] 4.22% | 32,043 | 9.5% |
[ 4.0% - 4.5% ] 4.47% | 12,554 | 11.0% |
[ 4.5% - 5.0% ] 4.63% | 6,609 | 13.9% |
[ 4.5% - 5.0% ] 4.83% | 10,943 | 13.2% |
[ 4.5% - 5.0% ] 4.97% | 71,284 | 13.5% |
[ 5.0% - 5.5% ] 5.26% | 22,286 | 8.6% |
[ 5.0% - 5.5% ] 5.37% | 1,508 | 12.6% |
[ 5.5% - 6.0% ] 5.89% | 950 | 23.0% |
[ 5.5% - 6.0% ] 5.92% | 64,994 | 14.8% |
[ 6.0% - 6.5% ] 6.23% | 835 | 24.5% |
[ 6.0% - 6.5% ] 6.46% | 19,969 | 12.7% |
[ 6.5% - 7.0% ] 6.58% | 3,665 | 48.9% |
[ 6.5% - 7.0% ] 6.75% | 1,022 | 28.6% |
[ 7.0% - 7.5% ] 7.01% | 16,211 | 13.2% |
[ 7.0% - 7.5% ] 7.12% | 4,947 | 9.9% |
[ 7.0% - 7.5% ] 7.43% | 4,873 | 24.6% |
[ 7.5% - 8.0% ] 7.53% | 332 | 7.0% |
[ 7.5% - 8.0% ] 7.93% | 29,089 | 10.6% |
[ 8.0% - 8.5% ] 8.43% | 36,359 | 13.6% |
[ 8.5% - 9.0% ] 8.52% | 622 | 25.9% |
[ 8.5% - 9.0% ] 8.74% | 40,152 | 13.5% |
[ 8.5% - 9.0% ] 8.93% | 56 | 29.0% |
[ 9.0% - 9.5% ] 9.39% | 2,280 | 13.8% |
[ 9.5% - 10.0% ] 9.80% | 51 | 4.2% |
[ 10.0% - 10.5% ] 10.40% | 404 | 6.4% |
[ 11.5% - 12.0% ] 11.80% | 881 | 14.1% |
[ 12.5% - 13.0% ] 12.61% | 238 | 11.9% |
[ 13.5% - 14.0% ] 13.51% | 74 | 34.5% |
[ 13.5% - 14.0% ] 13.87% | 137 | 44.4% |
[ 14.0% - 14.5% ] 14.48% | 3,812 | 7.8% |
[ 15.0% - 15.5% ] 15.44% | 136 | 9.9% |
[ 20.0% - 20.5% ] 20.00% | 105 | 45.6% |
[ 20.5% - 21.0% ] 20.59% | 102 | 15.4% |
[ 23.0% - 23.5% ] 23.29% | 73 | 5.6% |
[ 26.0% - 26.5% ] 26.35% | 1,875 | 8.0% |
[ 39.0% - 39.5% ] 39.47% | 38 | 28.6% |