Yugoslavian Disability
COMPARE
Yugoslavian
Select to Compare
Disability
Yugoslavian Disability
12.2%
DISABILITY
1.7/ 100
METRIC RATING
241st/ 347
METRIC RANK
Yugoslavian Disability Correlation Chart
The statistical analysis conducted on geographies consisting of 285,695,841 people shows a poor positive correlation between the proportion of Yugoslavians and percentage of population with a disability in the United States with a correlation coefficient (R) of 0.168 and weighted average of 12.2%. On average, for every 1% (one percent) increase in Yugoslavians within a typical geography, there is an increase of 0.13% in percentage of population with a disability.
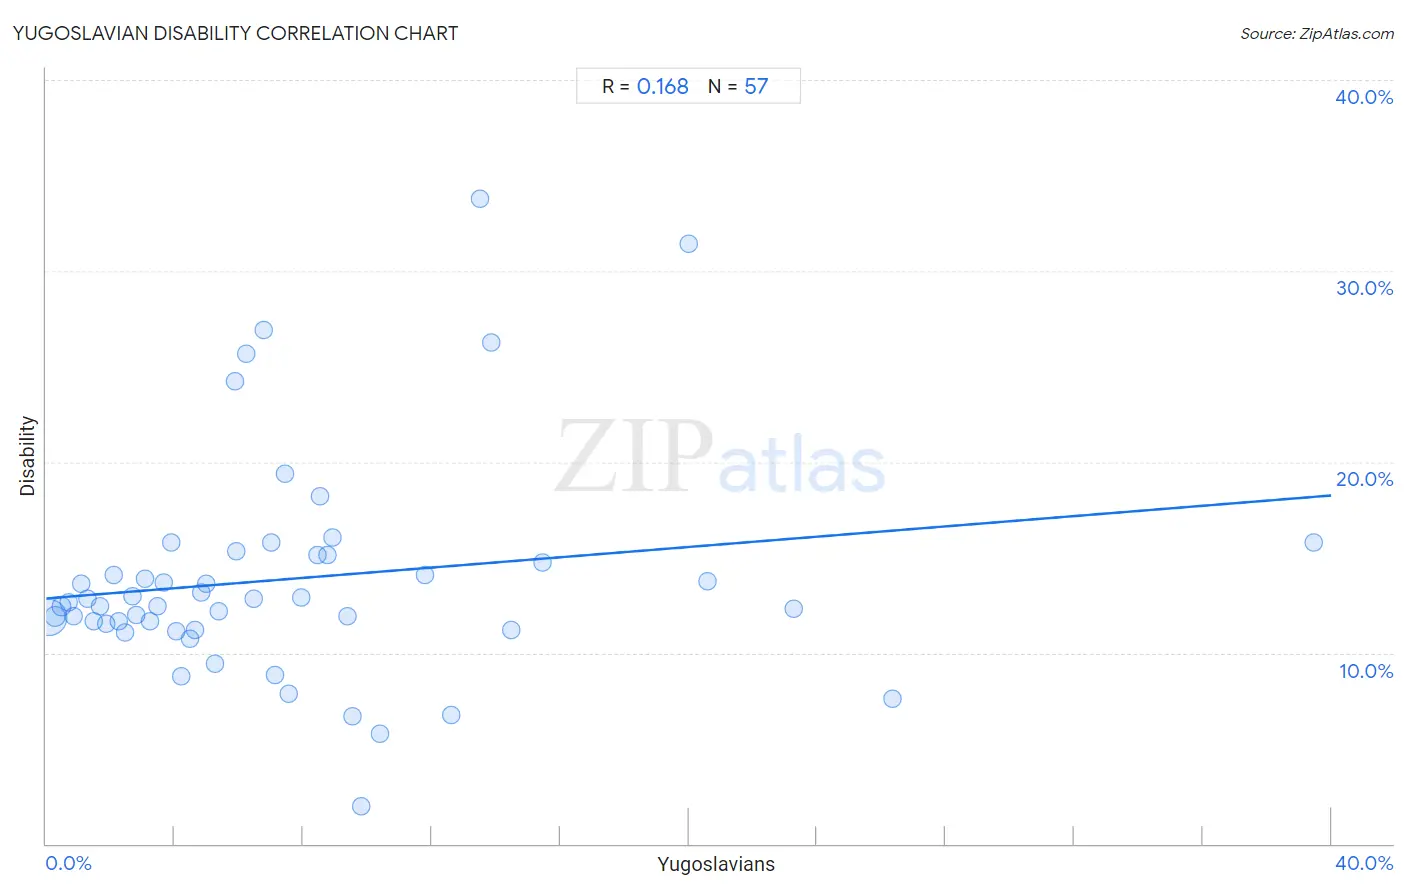
It is essential to understand that the correlation between the percentage of Yugoslavians and percentage of population with a disability does not imply a direct cause-and-effect relationship. It remains uncertain whether the presence of Yugoslavians influences an upward or downward trend in the level of percentage of population with a disability within an area, or if Yugoslavians simply ended up residing in those areas with higher or lower levels of percentage of population with a disability due to other factors.
Demographics Similar to Yugoslavians by Disability
In terms of disability, the demographic groups most similar to Yugoslavians are Hungarian (12.2%, a difference of 0.0%), Polish (12.2%, a difference of 0.020%), Swedish (12.2%, a difference of 0.050%), Norwegian (12.2%, a difference of 0.090%), and British (12.2%, a difference of 0.11%).
| Demographics | Rating | Rank | Disability |
| Japanese | 2.3 /100 | #234 | Tragic 12.2% |
| Yup'ik | 2.2 /100 | #235 | Tragic 12.2% |
| Chinese | 2.0 /100 | #236 | Tragic 12.2% |
| Immigrants from Congo | 1.9 /100 | #237 | Tragic 12.2% |
| Norwegians | 1.9 /100 | #238 | Tragic 12.2% |
| Swedes | 1.8 /100 | #239 | Tragic 12.2% |
| Hungarians | 1.7 /100 | #240 | Tragic 12.2% |
| Yugoslavians | 1.7 /100 | #241 | Tragic 12.2% |
| Poles | 1.7 /100 | #242 | Tragic 12.2% |
| British | 1.5 /100 | #243 | Tragic 12.2% |
| Basques | 1.5 /100 | #244 | Tragic 12.2% |
| Liberians | 1.5 /100 | #245 | Tragic 12.2% |
| Swiss | 1.5 /100 | #246 | Tragic 12.2% |
| Indonesians | 1.4 /100 | #247 | Tragic 12.2% |
| Guamanians/Chamorros | 1.4 /100 | #248 | Tragic 12.3% |
Yugoslavian Disability Correlation Summary
| Measurement | Yugoslavian Data | Disability Data |
| Minimum | 0.060% | 2.0% |
| Maximum | 39.5% | 33.8% |
| Range | 39.4% | 31.8% |
| Mean | 7.6% | 13.9% |
| Median | 5.9% | 12.6% |
| Interquartile 25% (IQ1) | 2.7% | 11.4% |
| Interquartile 75% (IQ3) | 9.5% | 15.1% |
| Interquartile Range (IQR) | 6.7% | 3.8% |
| Standard Deviation (Sample) | 7.2% | 5.8% |
| Standard Deviation (Population) | 7.2% | 5.8% |
Correlation Details
| Yugoslavian Percentile | Sample Size | Disability |
[ 0.0% - 0.5% ] 0.060% | 239,052,297 | 11.9% |
[ 0.0% - 0.5% ] 0.28% | 27,877,402 | 11.9% |
[ 0.0% - 0.5% ] 0.48% | 8,631,616 | 12.4% |
[ 0.5% - 1.0% ] 0.69% | 3,570,912 | 12.6% |
[ 0.5% - 1.0% ] 0.87% | 2,194,573 | 11.9% |
[ 1.0% - 1.5% ] 1.08% | 1,093,510 | 13.6% |
[ 1.0% - 1.5% ] 1.26% | 751,260 | 12.9% |
[ 1.0% - 1.5% ] 1.47% | 391,529 | 11.7% |
[ 1.5% - 2.0% ] 1.66% | 389,348 | 12.5% |
[ 1.5% - 2.0% ] 1.89% | 374,706 | 11.5% |
[ 2.0% - 2.5% ] 2.09% | 269,257 | 14.1% |
[ 2.0% - 2.5% ] 2.24% | 195,748 | 11.6% |
[ 2.0% - 2.5% ] 2.47% | 116,196 | 11.1% |
[ 2.5% - 3.0% ] 2.68% | 164,492 | 13.0% |
[ 2.5% - 3.0% ] 2.79% | 44,297 | 12.0% |
[ 3.0% - 3.5% ] 3.06% | 28,373 | 13.9% |
[ 3.0% - 3.5% ] 3.22% | 51,411 | 11.7% |
[ 3.0% - 3.5% ] 3.45% | 85,120 | 12.4% |
[ 3.5% - 4.0% ] 3.67% | 5,070 | 13.7% |
[ 3.5% - 4.0% ] 3.88% | 8,180 | 15.8% |
[ 4.0% - 4.5% ] 4.05% | 11,563 | 11.1% |
[ 4.0% - 4.5% ] 4.22% | 32,592 | 8.8% |
[ 4.0% - 4.5% ] 4.47% | 12,554 | 10.7% |
[ 4.5% - 5.0% ] 4.63% | 6,609 | 11.2% |
[ 4.5% - 5.0% ] 4.83% | 10,984 | 13.1% |
[ 4.5% - 5.0% ] 4.97% | 71,284 | 13.6% |
[ 5.0% - 5.5% ] 5.26% | 22,286 | 9.4% |
[ 5.0% - 5.5% ] 5.37% | 1,508 | 12.2% |
[ 5.5% - 6.0% ] 5.89% | 950 | 24.2% |
[ 5.5% - 6.0% ] 5.92% | 64,994 | 15.3% |
[ 6.0% - 6.5% ] 6.23% | 835 | 25.7% |
[ 6.0% - 6.5% ] 6.46% | 19,969 | 12.9% |
[ 6.5% - 7.0% ] 6.75% | 1,022 | 26.9% |
[ 7.0% - 7.5% ] 7.01% | 16,211 | 15.8% |
[ 7.0% - 7.5% ] 7.12% | 4,947 | 8.8% |
[ 7.0% - 7.5% ] 7.43% | 4,873 | 19.4% |
[ 7.5% - 8.0% ] 7.53% | 332 | 7.8% |
[ 7.5% - 8.0% ] 7.93% | 29,089 | 12.9% |
[ 8.0% - 8.5% ] 8.43% | 36,359 | 15.1% |
[ 8.5% - 9.0% ] 8.52% | 622 | 18.2% |
[ 8.5% - 9.0% ] 8.74% | 40,152 | 15.1% |
[ 8.5% - 9.0% ] 8.93% | 56 | 16.1% |
[ 9.0% - 9.5% ] 9.39% | 2,280 | 11.9% |
[ 9.5% - 10.0% ] 9.52% | 105 | 6.7% |
[ 9.5% - 10.0% ] 9.80% | 51 | 2.0% |
[ 10.0% - 10.5% ] 10.40% | 846 | 5.8% |
[ 11.5% - 12.0% ] 11.80% | 881 | 14.1% |
[ 12.5% - 13.0% ] 12.61% | 238 | 6.7% |
[ 13.5% - 14.0% ] 13.51% | 74 | 33.8% |
[ 13.5% - 14.0% ] 13.87% | 137 | 26.3% |
[ 14.0% - 14.5% ] 14.48% | 3,812 | 11.2% |
[ 15.0% - 15.5% ] 15.44% | 136 | 14.7% |
[ 20.0% - 20.5% ] 20.00% | 105 | 31.4% |
[ 20.5% - 21.0% ] 20.59% | 102 | 13.7% |
[ 23.0% - 23.5% ] 23.29% | 73 | 12.3% |
[ 26.0% - 26.5% ] 26.35% | 1,875 | 7.6% |
[ 39.0% - 39.5% ] 39.47% | 38 | 15.8% |