Yugoslavian Married-couple Households
COMPARE
Yugoslavian
Select to Compare
Married-couple Households
Yugoslavian Married-couple Households
46.2%
MARRIED-COUPLE HOUSEHOLDS
38.9/ 100
METRIC RATING
182nd/ 347
METRIC RANK
Yugoslavian Married-couple Households Correlation Chart
The statistical analysis conducted on geographies consisting of 285,634,197 people shows a poor positive correlation between the proportion of Yugoslavians and percentage of married-couple family households in the United States with a correlation coefficient (R) of 0.159 and weighted average of 46.2%. On average, for every 1% (one percent) increase in Yugoslavians within a typical geography, there is an increase of 0.19% in percentage of married-couple family households.
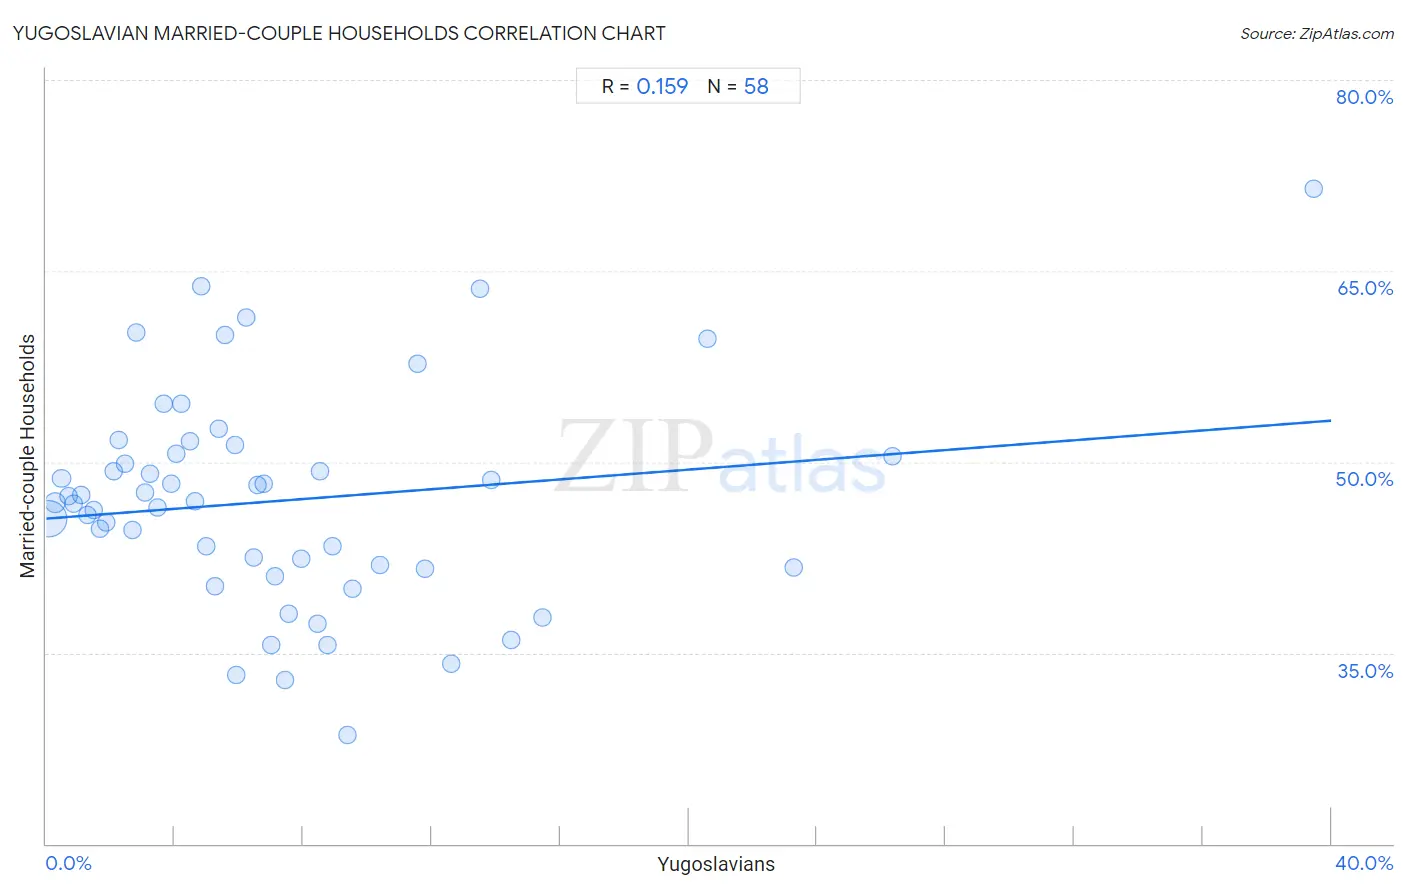
It is essential to understand that the correlation between the percentage of Yugoslavians and percentage of married-couple family households does not imply a direct cause-and-effect relationship. It remains uncertain whether the presence of Yugoslavians influences an upward or downward trend in the level of percentage of married-couple family households within an area, or if Yugoslavians simply ended up residing in those areas with higher or lower levels of percentage of married-couple family households due to other factors.
Demographics Similar to Yugoslavians by Married-couple Households
In terms of married-couple households, the demographic groups most similar to Yugoslavians are Immigrants from Brazil (46.2%, a difference of 0.020%), Immigrants from Switzerland (46.2%, a difference of 0.080%), Mongolian (46.3%, a difference of 0.12%), Malaysian (46.3%, a difference of 0.12%), and Brazilian (46.2%, a difference of 0.12%).
| Demographics | Rating | Rank | Married-couple Households |
| Immigrants from Colombia | 46.1 /100 | #175 | Average 46.4% |
| Cajuns | 45.2 /100 | #176 | Average 46.4% |
| Immigrants | 43.8 /100 | #177 | Average 46.3% |
| Immigrants from Costa Rica | 43.4 /100 | #178 | Average 46.3% |
| Immigrants from Zimbabwe | 43.0 /100 | #179 | Average 46.3% |
| Mongolians | 42.0 /100 | #180 | Average 46.3% |
| Malaysians | 41.8 /100 | #181 | Average 46.3% |
| Yugoslavians | 38.9 /100 | #182 | Fair 46.2% |
| Immigrants from Brazil | 38.3 /100 | #183 | Fair 46.2% |
| Immigrants from Switzerland | 36.9 /100 | #184 | Fair 46.2% |
| Brazilians | 35.9 /100 | #185 | Fair 46.2% |
| Albanians | 31.1 /100 | #186 | Fair 46.1% |
| Fijians | 29.2 /100 | #187 | Fair 46.1% |
| South American Indians | 28.4 /100 | #188 | Fair 46.0% |
| Immigrants from Latvia | 26.9 /100 | #189 | Fair 46.0% |
Yugoslavian Married-couple Households Correlation Summary
| Measurement | Yugoslavian Data | Married-couple Households Data |
| Minimum | 0.060% | 28.5% |
| Maximum | 39.5% | 71.4% |
| Range | 39.4% | 42.9% |
| Mean | 7.3% | 47.0% |
| Median | 5.7% | 46.8% |
| Interquartile 25% (IQ1) | 2.8% | 41.7% |
| Interquartile 75% (IQ3) | 8.9% | 50.6% |
| Interquartile Range (IQR) | 6.1% | 9.0% |
| Standard Deviation (Sample) | 7.0% | 8.5% |
| Standard Deviation (Population) | 6.9% | 8.4% |
Correlation Details
| Yugoslavian Percentile | Sample Size | Married-couple Households |
[ 0.0% - 0.5% ] 0.060% | 238,997,832 | 45.6% |
[ 0.0% - 0.5% ] 0.28% | 27,870,748 | 46.8% |
[ 0.0% - 0.5% ] 0.48% | 8,630,804 | 48.7% |
[ 0.5% - 1.0% ] 0.68% | 3,568,517 | 47.3% |
[ 0.5% - 1.0% ] 0.87% | 2,193,517 | 46.7% |
[ 1.0% - 1.5% ] 1.08% | 1,093,165 | 47.4% |
[ 1.0% - 1.5% ] 1.26% | 751,260 | 45.9% |
[ 1.0% - 1.5% ] 1.47% | 391,529 | 46.2% |
[ 1.5% - 2.0% ] 1.66% | 389,348 | 44.8% |
[ 1.5% - 2.0% ] 1.89% | 374,706 | 45.2% |
[ 2.0% - 2.5% ] 2.09% | 269,257 | 49.3% |
[ 2.0% - 2.5% ] 2.24% | 195,748 | 51.7% |
[ 2.0% - 2.5% ] 2.47% | 116,196 | 49.9% |
[ 2.5% - 3.0% ] 2.68% | 164,492 | 44.7% |
[ 2.5% - 3.0% ] 2.79% | 44,297 | 60.1% |
[ 3.0% - 3.5% ] 3.06% | 28,373 | 47.6% |
[ 3.0% - 3.5% ] 3.22% | 51,411 | 49.1% |
[ 3.0% - 3.5% ] 3.45% | 85,120 | 46.4% |
[ 3.5% - 4.0% ] 3.67% | 5,070 | 54.6% |
[ 3.5% - 4.0% ] 3.88% | 8,180 | 48.3% |
[ 4.0% - 4.5% ] 4.05% | 11,563 | 50.6% |
[ 4.0% - 4.5% ] 4.22% | 32,592 | 54.5% |
[ 4.0% - 4.5% ] 4.47% | 12,554 | 51.6% |
[ 4.5% - 5.0% ] 4.63% | 6,609 | 46.9% |
[ 4.5% - 5.0% ] 4.83% | 10,984 | 63.8% |
[ 4.5% - 5.0% ] 4.97% | 71,284 | 43.3% |
[ 5.0% - 5.5% ] 5.26% | 22,286 | 40.2% |
[ 5.0% - 5.5% ] 5.37% | 1,508 | 52.6% |
[ 5.5% - 6.0% ] 5.56% | 72 | 60.0% |
[ 5.5% - 6.0% ] 5.89% | 950 | 51.4% |
[ 5.5% - 6.0% ] 5.92% | 64,994 | 33.3% |
[ 6.0% - 6.5% ] 6.23% | 835 | 61.3% |
[ 6.0% - 6.5% ] 6.46% | 19,969 | 42.5% |
[ 6.5% - 7.0% ] 6.58% | 3,665 | 48.2% |
[ 6.5% - 7.0% ] 6.75% | 1,022 | 48.3% |
[ 7.0% - 7.5% ] 7.01% | 16,211 | 35.7% |
[ 7.0% - 7.5% ] 7.12% | 4,947 | 41.0% |
[ 7.0% - 7.5% ] 7.43% | 4,873 | 32.9% |
[ 7.5% - 8.0% ] 7.53% | 332 | 38.1% |
[ 7.5% - 8.0% ] 7.93% | 29,089 | 42.4% |
[ 8.0% - 8.5% ] 8.43% | 36,359 | 37.3% |
[ 8.5% - 9.0% ] 8.52% | 622 | 49.3% |
[ 8.5% - 9.0% ] 8.74% | 40,152 | 35.6% |
[ 8.5% - 9.0% ] 8.93% | 56 | 43.3% |
[ 9.0% - 9.5% ] 9.39% | 2,280 | 28.5% |
[ 9.5% - 10.0% ] 9.52% | 105 | 40.0% |
[ 10.0% - 10.5% ] 10.40% | 846 | 41.9% |
[ 11.5% - 12.0% ] 11.55% | 502 | 57.7% |
[ 11.5% - 12.0% ] 11.80% | 881 | 41.6% |
[ 12.5% - 13.0% ] 12.61% | 238 | 34.1% |
[ 13.5% - 14.0% ] 13.51% | 74 | 63.6% |
[ 13.5% - 14.0% ] 13.87% | 137 | 48.5% |
[ 14.0% - 14.5% ] 14.48% | 3,812 | 36.0% |
[ 15.0% - 15.5% ] 15.44% | 136 | 37.7% |
[ 20.5% - 21.0% ] 20.59% | 102 | 59.6% |
[ 23.0% - 23.5% ] 23.29% | 73 | 41.7% |
[ 26.0% - 26.5% ] 26.35% | 1,875 | 50.5% |
[ 39.0% - 39.5% ] 39.47% | 38 | 71.4% |