Yugoslavian College, 1 year or more
COMPARE
Yugoslavian
Select to Compare
College, 1 year or more
Yugoslavian College, 1 year or more
59.2%
COLLEGE, 1 YEAR OR MORE
44.1/ 100
METRIC RATING
180th/ 347
METRIC RANK
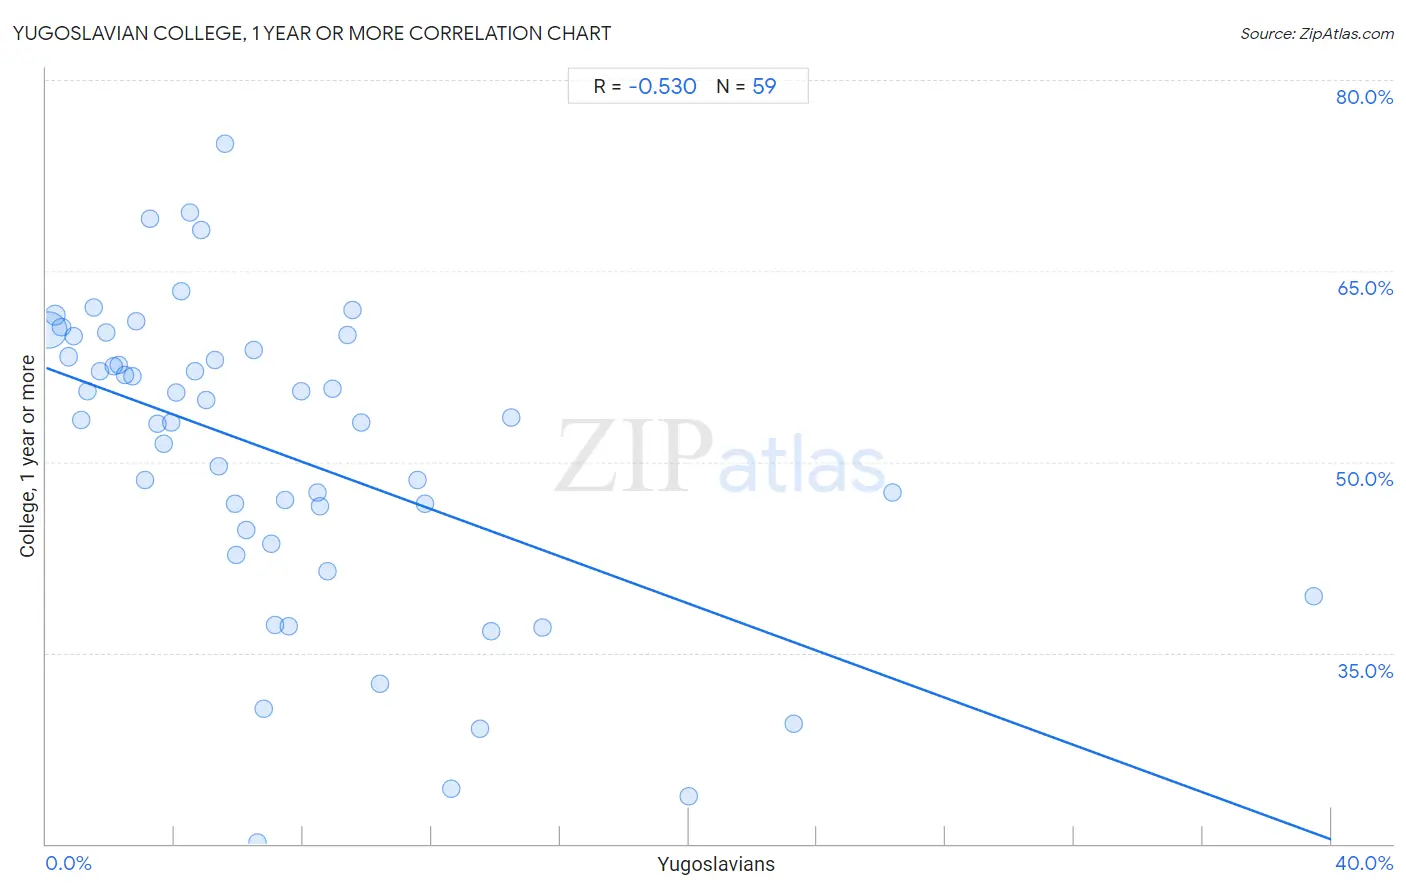
Yugoslavian College, 1 year or more Correlation Chart
The statistical analysis conducted on geographies consisting of 285,723,201 people shows a substantial negative correlation between the proportion of Yugoslavians and percentage of population with at least college, 1 year or more education in the United States with a correlation coefficient (R) of -0.530 and weighted average of 59.2%. On average, for every 1% (one percent) increase in Yugoslavians within a typical geography, there is a decrease of 0.93% in percentage of population with at least college, 1 year or more education.
It is essential to understand that the correlation between the percentage of Yugoslavians and percentage of population with at least college, 1 year or more education does not imply a direct cause-and-effect relationship. It remains uncertain whether the presence of Yugoslavians influences an upward or downward trend in the level of percentage of population with at least college, 1 year or more education within an area, or if Yugoslavians simply ended up residing in those areas with higher or lower levels of percentage of population with at least college, 1 year or more education due to other factors.
Demographics Similar to Yugoslavians by College, 1 year or more
In terms of college, 1 year or more, the demographic groups most similar to Yugoslavians are Swiss (59.2%, a difference of 0.040%), Immigrants from Bosnia and Herzegovina (59.2%, a difference of 0.070%), Bermudan (59.3%, a difference of 0.14%), Tlingit-Haida (59.4%, a difference of 0.23%), and Czechoslovakian (59.4%, a difference of 0.23%).
| Demographics | Rating | Rank | College, 1 year or more |
| Immigrants from Oceania | 51.2 /100 | #173 | Average 59.4% |
| Celtics | 50.0 /100 | #174 | Average 59.4% |
| Sri Lankans | 49.0 /100 | #175 | Average 59.4% |
| Immigrants from Poland | 48.9 /100 | #176 | Average 59.4% |
| Tlingit-Haida | 48.4 /100 | #177 | Average 59.4% |
| Czechoslovakians | 48.3 /100 | #178 | Average 59.4% |
| Bermudans | 46.6 /100 | #179 | Average 59.3% |
| Yugoslavians | 44.1 /100 | #180 | Average 59.2% |
| Swiss | 43.4 /100 | #181 | Average 59.2% |
| Immigrants from Bosnia and Herzegovina | 42.8 /100 | #182 | Average 59.2% |
| German Russians | 39.3 /100 | #183 | Fair 59.1% |
| Spaniards | 38.3 /100 | #184 | Fair 59.0% |
| South Americans | 35.9 /100 | #185 | Fair 59.0% |
| Scotch-Irish | 34.7 /100 | #186 | Fair 58.9% |
| Germans | 34.7 /100 | #187 | Fair 58.9% |
Yugoslavian College, 1 year or more Correlation Summary
| Measurement | Yugoslavian Data | College, 1 year or more Data |
| Minimum | 0.060% | 20.1% |
| Maximum | 39.5% | 75.0% |
| Range | 39.4% | 54.9% |
| Mean | 7.3% | 50.6% |
| Median | 5.9% | 53.3% |
| Interquartile 25% (IQ1) | 2.8% | 43.6% |
| Interquartile 75% (IQ3) | 9.4% | 58.8% |
| Interquartile Range (IQR) | 6.6% | 15.2% |
| Standard Deviation (Sample) | 6.9% | 12.1% |
| Standard Deviation (Population) | 6.9% | 12.0% |
Correlation Details
| Yugoslavian Percentile | Sample Size | College, 1 year or more |
[ 0.0% - 0.5% ] 0.060% | 239,064,011 | 60.3% |
[ 0.0% - 0.5% ] 0.28% | 27,882,667 | 61.5% |
[ 0.0% - 0.5% ] 0.48% | 8,635,864 | 60.6% |
[ 0.5% - 1.0% ] 0.69% | 3,570,912 | 58.3% |
[ 0.5% - 1.0% ] 0.87% | 2,193,517 | 59.9% |
[ 1.0% - 1.5% ] 1.08% | 1,093,510 | 53.3% |
[ 1.0% - 1.5% ] 1.26% | 753,790 | 55.5% |
[ 1.0% - 1.5% ] 1.47% | 391,529 | 62.1% |
[ 1.5% - 2.0% ] 1.66% | 389,870 | 57.1% |
[ 1.5% - 2.0% ] 1.89% | 374,706 | 60.2% |
[ 2.0% - 2.5% ] 2.09% | 269,257 | 57.5% |
[ 2.0% - 2.5% ] 2.24% | 195,748 | 57.6% |
[ 2.0% - 2.5% ] 2.47% | 116,196 | 56.8% |
[ 2.5% - 3.0% ] 2.68% | 164,492 | 56.8% |
[ 2.5% - 3.0% ] 2.79% | 44,297 | 61.1% |
[ 3.0% - 3.5% ] 3.06% | 28,373 | 48.5% |
[ 3.0% - 3.5% ] 3.22% | 51,411 | 69.1% |
[ 3.0% - 3.5% ] 3.45% | 85,120 | 53.0% |
[ 3.5% - 4.0% ] 3.67% | 5,070 | 51.5% |
[ 3.5% - 4.0% ] 3.88% | 8,180 | 53.1% |
[ 4.0% - 4.5% ] 4.05% | 11,563 | 55.5% |
[ 4.0% - 4.5% ] 4.22% | 32,592 | 63.4% |
[ 4.0% - 4.5% ] 4.47% | 12,554 | 69.6% |
[ 4.5% - 5.0% ] 4.63% | 6,609 | 57.2% |
[ 4.5% - 5.0% ] 4.83% | 10,984 | 68.2% |
[ 4.5% - 5.0% ] 4.97% | 71,284 | 54.8% |
[ 5.0% - 5.5% ] 5.26% | 22,286 | 58.1% |
[ 5.0% - 5.5% ] 5.37% | 1,508 | 49.7% |
[ 5.5% - 6.0% ] 5.56% | 72 | 75.0% |
[ 5.5% - 6.0% ] 5.89% | 950 | 46.7% |
[ 5.5% - 6.0% ] 5.92% | 64,994 | 42.6% |
[ 6.0% - 6.5% ] 6.23% | 835 | 44.7% |
[ 6.0% - 6.5% ] 6.46% | 19,969 | 58.8% |
[ 6.5% - 7.0% ] 6.58% | 3,665 | 20.1% |
[ 6.5% - 7.0% ] 6.75% | 1,022 | 30.6% |
[ 7.0% - 7.5% ] 7.01% | 16,211 | 43.6% |
[ 7.0% - 7.5% ] 7.12% | 4,947 | 37.2% |
[ 7.0% - 7.5% ] 7.43% | 4,873 | 47.0% |
[ 7.5% - 8.0% ] 7.53% | 332 | 37.1% |
[ 7.5% - 8.0% ] 7.93% | 29,089 | 55.6% |
[ 8.0% - 8.5% ] 8.43% | 36,359 | 47.6% |
[ 8.5% - 9.0% ] 8.52% | 622 | 46.5% |
[ 8.5% - 9.0% ] 8.74% | 40,152 | 41.4% |
[ 8.5% - 9.0% ] 8.93% | 56 | 55.8% |
[ 9.0% - 9.5% ] 9.39% | 2,280 | 60.0% |
[ 9.5% - 10.0% ] 9.52% | 105 | 61.9% |
[ 9.5% - 10.0% ] 9.80% | 51 | 53.1% |
[ 10.0% - 10.5% ] 10.40% | 846 | 32.6% |
[ 11.5% - 12.0% ] 11.55% | 502 | 48.6% |
[ 11.5% - 12.0% ] 11.80% | 881 | 46.7% |
[ 12.5% - 13.0% ] 12.61% | 238 | 24.4% |
[ 13.5% - 14.0% ] 13.51% | 74 | 29.0% |
[ 13.5% - 14.0% ] 13.87% | 137 | 36.7% |
[ 14.0% - 14.5% ] 14.48% | 3,812 | 53.5% |
[ 15.0% - 15.5% ] 15.44% | 136 | 37.0% |
[ 20.0% - 20.5% ] 20.00% | 105 | 23.8% |
[ 23.0% - 23.5% ] 23.29% | 73 | 29.4% |
[ 26.0% - 26.5% ] 26.35% | 1,875 | 47.6% |
[ 39.0% - 39.5% ] 39.47% | 38 | 39.5% |