South African Disability
COMPARE
South African
Select to Compare
Disability
South African Disability
11.4%
DISABILITY
92.3/ 100
METRIC RATING
123rd/ 347
METRIC RANK
South African Disability Correlation Chart
The statistical analysis conducted on geographies consisting of 182,593,286 people shows a significant positive correlation between the proportion of South Africans and percentage of population with a disability in the United States with a correlation coefficient (R) of 0.626 and weighted average of 11.4%. On average, for every 1% (one percent) increase in South Africans within a typical geography, there is an increase of 0.55% in percentage of population with a disability.
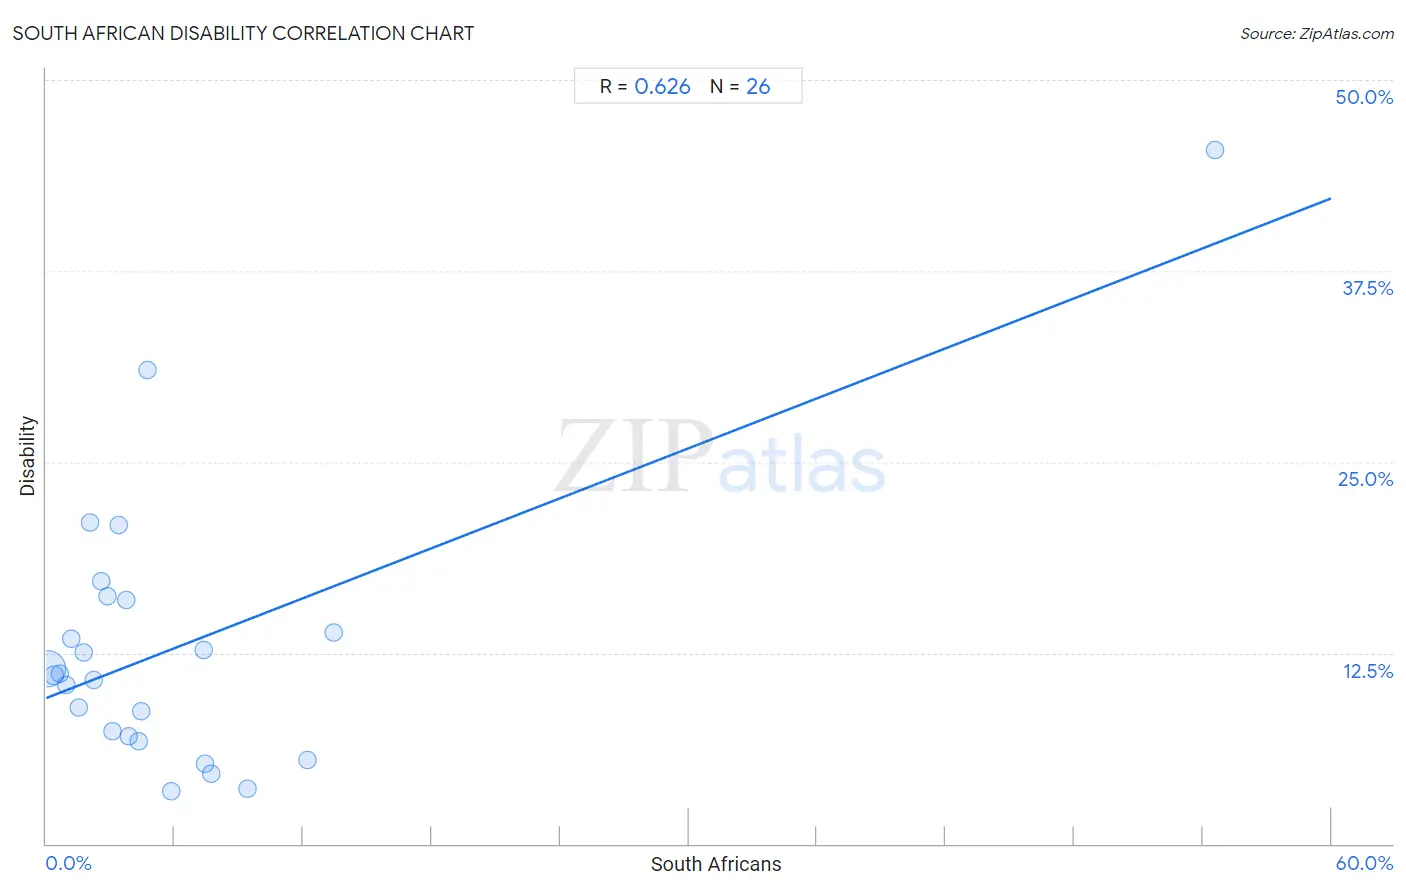
It is essential to understand that the correlation between the percentage of South Africans and percentage of population with a disability does not imply a direct cause-and-effect relationship. It remains uncertain whether the presence of South Africans influences an upward or downward trend in the level of percentage of population with a disability within an area, or if South Africans simply ended up residing in those areas with higher or lower levels of percentage of population with a disability due to other factors.
Demographics Similar to South Africans by Disability
In terms of disability, the demographic groups most similar to South Africans are South American Indian (11.4%, a difference of 0.020%), Costa Rican (11.4%, a difference of 0.060%), Brazilian (11.4%, a difference of 0.17%), Immigrants from Costa Rica (11.4%, a difference of 0.20%), and Central American (11.4%, a difference of 0.21%).
| Demographics | Rating | Rank | Disability |
| Immigrants from Northern Europe | 94.1 /100 | #116 | Exceptional 11.3% |
| Luxembourgers | 93.9 /100 | #117 | Exceptional 11.3% |
| Koreans | 93.8 /100 | #118 | Exceptional 11.3% |
| Central Americans | 93.5 /100 | #119 | Exceptional 11.4% |
| Immigrants from North Macedonia | 93.5 /100 | #120 | Exceptional 11.4% |
| Immigrants from Costa Rica | 93.4 /100 | #121 | Exceptional 11.4% |
| Brazilians | 93.3 /100 | #122 | Exceptional 11.4% |
| South Africans | 92.3 /100 | #123 | Exceptional 11.4% |
| South American Indians | 92.2 /100 | #124 | Exceptional 11.4% |
| Costa Ricans | 91.9 /100 | #125 | Exceptional 11.4% |
| Immigrants from Latvia | 90.9 /100 | #126 | Exceptional 11.4% |
| Immigrants from Italy | 90.4 /100 | #127 | Exceptional 11.4% |
| Immigrants from Europe | 90.4 /100 | #128 | Exceptional 11.4% |
| Macedonians | 90.3 /100 | #129 | Exceptional 11.4% |
| Latvians | 89.8 /100 | #130 | Excellent 11.4% |
South African Disability Correlation Summary
| Measurement | South African Data | Disability Data |
| Minimum | 0.053% | 3.4% |
| Maximum | 54.5% | 45.5% |
| Range | 54.5% | 42.0% |
| Mean | 6.2% | 12.9% |
| Median | 3.6% | 11.1% |
| Interquartile 25% (IQ1) | 1.8% | 7.0% |
| Interquartile 75% (IQ3) | 7.3% | 15.9% |
| Interquartile Range (IQR) | 5.6% | 8.9% |
| Standard Deviation (Sample) | 10.5% | 9.1% |
| Standard Deviation (Population) | 10.3% | 8.9% |
Correlation Details
| South African Percentile | Sample Size | Disability |
[ 0.0% - 0.5% ] 0.053% | 173,911,731 | 11.4% |
[ 0.0% - 0.5% ] 0.36% | 5,959,141 | 11.0% |
[ 0.5% - 1.0% ] 0.66% | 1,548,280 | 11.1% |
[ 0.5% - 1.0% ] 0.95% | 553,077 | 10.4% |
[ 1.0% - 1.5% ] 1.18% | 173,503 | 13.4% |
[ 1.0% - 1.5% ] 1.50% | 150,215 | 8.9% |
[ 1.5% - 2.0% ] 1.77% | 69,808 | 12.6% |
[ 2.0% - 2.5% ] 2.04% | 58,268 | 21.0% |
[ 2.0% - 2.5% ] 2.20% | 21,693 | 10.8% |
[ 2.5% - 3.0% ] 2.59% | 32,668 | 17.2% |
[ 2.5% - 3.0% ] 2.86% | 21,577 | 16.2% |
[ 3.0% - 3.5% ] 3.08% | 38,114 | 7.4% |
[ 3.0% - 3.5% ] 3.37% | 4,717 | 20.9% |
[ 3.5% - 4.0% ] 3.73% | 9,890 | 15.9% |
[ 3.5% - 4.0% ] 3.84% | 26,498 | 7.0% |
[ 4.0% - 4.5% ] 4.34% | 4,450 | 6.7% |
[ 4.0% - 4.5% ] 4.46% | 3,541 | 8.6% |
[ 4.5% - 5.0% ] 4.74% | 190 | 31.1% |
[ 5.5% - 6.0% ] 5.84% | 377 | 3.4% |
[ 7.0% - 7.5% ] 7.33% | 1,638 | 12.7% |
[ 7.0% - 7.5% ] 7.39% | 1,841 | 5.2% |
[ 7.5% - 8.0% ] 7.69% | 65 | 4.6% |
[ 9.0% - 9.5% ] 9.40% | 755 | 3.6% |
[ 12.0% - 12.5% ] 12.18% | 985 | 5.5% |
[ 13.0% - 13.5% ] 13.44% | 253 | 13.8% |
[ 54.5% - 55.0% ] 54.55% | 11 | 45.5% |