South African GED/Equivalency

COMPARE

South African
Race
Ancestry
AfghanAfricanAlaska NativeAlaskan AthabascanAlbanianAleutAlsatianAmericanApacheArabArapahoArgentineanArmenianAssyrian/Chaldean/SyriacAustralianAustrianBahamianBangladeshiBarbadianBasqueBelgianBelizeanBermudanBhutaneseBlackfeetBolivianBrazilianBritishBritish West IndianBulgarianBurmeseCajunCambodianCanadianCape VerdeanCarpatho RusynCelticCentral AmericanCentral American IndianCherokeeCheyenneChickasawChileanChineseChippewaChoctawColombianColvilleComancheCosta RicanCreeCreekCroatianCrowCubanCypriotCzechCzechoslovakianDanishDelawareDominicanDutchDutch West IndianEastern EuropeanEcuadorianEgyptianEnglishEstonianEthiopianEuropeanFijianFilipinoFinnishFrenchFrench American IndianFrench CanadianGermanGerman RussianGhanaianGreekGuamanian/ChamorroGuatemalanGuyaneseHaitianHmongHonduranHopiHoumaHungarianIcelanderIndian (Asian)IndonesianInupiatIranianIraqiIrishIroquoisIsraeliItalianJamaicanJapaneseJordanianKenyanKiowaKoreanLaotianLatvianLebaneseLiberianLithuanianLumbeeLuxembourgerMacedonianMalaysianMalteseMarshalleseMenomineeMexicanMexican American IndianMongolianMoroccanNative HawaiianNavajoNepaleseNew ZealanderNicaraguanNigerianNorthern EuropeanNorwegianOkinawanOsageOttawaPaiutePakistaniPalestinianPanamanianParaguayanPennsylvania GermanPeruvianPimaPolishPortuguesePotawatomiPuebloPuerto RicanPuget Sound SalishRomanianRussianSalvadoranSamoanScandinavianScotch-IrishScottishSeminoleSenegaleseSerbianShoshoneSierra LeoneanSiouxSlavicSlovakSloveneSomaliSouth AfricanSouth AmericanSouth American IndianSoviet UnionSpaniardSpanishSpanish AmericanSpanish American IndianSri LankanSubsaharan AfricanSudaneseSwedishSwissSyrianTaiwaneseThaiTlingit-HaidaTohono O'OdhamTonganTrinidadian and TobagonianTsimshianTurkishU.S. Virgin IslanderUgandanUkrainianUruguayanUteVenezuelanVietnameseWelshWest IndianYakamaYaquiYugoslavianYumanYup'ikZimbabwean
Immigration
NonimmigrantsImmigrantsAfghanistanAfricaAlbaniaArgentinaArmeniaAsiaAustraliaAustriaBahamasBangladeshBarbadosBelarusBelgiumBelizeBoliviaBosnia and HerzegovinaBrazilBulgariaBurma/MyanmarCabo VerdeCambodiaCameroonCanadaCaribbeanCentral AmericaChileChinaColombiaCongoCosta RicaCroatiaCubaCzechoslovakiaDenmarkDominicaDominican RepublicEastern AfricaEastern AsiaEastern EuropeEcuadorEgyptEl SalvadorEnglandEritreaEthiopiaEuropeFijiFranceGermanyGhanaGreeceGrenadaGuatemalaGuyanaHaitiHondurasHong KongHungaryIndiaIndonesiaIranIraqIrelandIsraelItalyJamaicaJapanJordanKazakhstanKenyaKoreaKuwaitLaosLatin AmericaLatviaLebanonLiberiaLithuaniaMalaysiaMexicoMicronesiaMiddle AfricaMoldovaMoroccoNepalNetherlandsNicaraguaNigeriaNorth AmericaNorth MacedoniaNorthern AfricaNorthern EuropeNorwayOceaniaPakistanPanamaPeruPhilippinesPolandPortugalRomaniaRussiaSaudi ArabiaScotlandSenegalSerbiaSierra LeoneSingaporeSomaliaSouth AfricaSouth AmericaSouth Central AsiaSouth Eastern AsiaSouthern EuropeSpainSri LankaSt. Vincent and the GrenadinesSudanSwedenSwitzerlandSyriaTaiwanThailandTrinidad and TobagoTurkeyUgandaUkraineUruguayUzbekistanVenezuelaVietnamWest IndiesWestern AfricaWestern AsiaWestern EuropeYemenZaireZimbabweAzores
Select to Compare
Race
Ancestry
AfghanAfricanAlaska NativeAlaskan AthabascanAlbanianAleutAlsatianAmericanApacheArabArapahoArgentineanArmenianAssyrian/Chaldean/SyriacAustralianAustrianBahamianBangladeshiBarbadianBasqueBelgianBelizeanBermudanBhutaneseBlackfeetBolivianBrazilianBritishBritish West IndianBulgarianBurmeseCajunCambodianCanadianCape VerdeanCarpatho RusynCelticCentral AmericanCentral American IndianCherokeeCheyenneChickasawChileanChineseChippewaChoctawColombianColvilleComancheCosta RicanCreeCreekCroatianCrowCubanCypriotCzechCzechoslovakianDanishDelawareDominicanDutchDutch West IndianEastern EuropeanEcuadorianEgyptianEnglishEstonianEthiopianEuropeanFijianFilipinoFinnishFrenchFrench American IndianFrench CanadianGermanGerman RussianGhanaianGreekGuamanian/ChamorroGuatemalanGuyaneseHaitianHmongHonduranHopiHoumaHungarianIcelanderIndian (Asian)IndonesianInupiatIranianIraqiIrishIroquoisIsraeliItalianJamaicanJapaneseJordanianKenyanKiowaKoreanLaotianLatvianLebaneseLiberianLithuanianLumbeeLuxembourgerMacedonianMalaysianMalteseMarshalleseMenomineeMexicanMexican American IndianMongolianMoroccanNative HawaiianNavajoNepaleseNew ZealanderNicaraguanNigerianNorthern EuropeanNorwegianOkinawanOsageOttawaPaiutePakistaniPalestinianPanamanianParaguayanPennsylvania GermanPeruvianPimaPolishPortuguesePotawatomiPuebloPuerto RicanPuget Sound SalishRomanianRussianSalvadoranSamoanScandinavianScotch-IrishScottishSeminoleSenegaleseSerbianShoshoneSierra LeoneanSiouxSlavicSlovakSloveneSomaliSouth AmericanSouth American IndianSoviet UnionSpaniardSpanishSpanish AmericanSpanish American IndianSri LankanSubsaharan AfricanSudaneseSwedishSwissSyrianTaiwaneseThaiTlingit-HaidaTohono O'OdhamTonganTrinidadian and TobagonianTsimshianTurkishU.S. Virgin IslanderUgandanUkrainianUruguayanUteVenezuelanVietnameseWelshWest IndianYakamaYaquiYugoslavianYumanYup'ikZimbabwean
Immigration
NonimmigrantsImmigrantsAfghanistanAfricaAlbaniaArgentinaArmeniaAsiaAustraliaAustriaBahamasBangladeshBarbadosBelarusBelgiumBelizeBoliviaBosnia and HerzegovinaBrazilBulgariaBurma/MyanmarCabo VerdeCambodiaCameroonCanadaCaribbeanCentral AmericaChileChinaColombiaCongoCosta RicaCroatiaCubaCzechoslovakiaDenmarkDominicaDominican RepublicEastern AfricaEastern AsiaEastern EuropeEcuadorEgyptEl SalvadorEnglandEritreaEthiopiaEuropeFijiFranceGermanyGhanaGreeceGrenadaGuatemalaGuyanaHaitiHondurasHong KongHungaryIndiaIndonesiaIranIraqIrelandIsraelItalyJamaicaJapanJordanKazakhstanKenyaKoreaKuwaitLaosLatin AmericaLatviaLebanonLiberiaLithuaniaMalaysiaMexicoMicronesiaMiddle AfricaMoldovaMoroccoNepalNetherlandsNicaraguaNigeriaNorth AmericaNorth MacedoniaNorthern AfricaNorthern EuropeNorwayOceaniaPakistanPanamaPeruPhilippinesPolandPortugalRomaniaRussiaSaudi ArabiaScotlandSenegalSerbiaSierra LeoneSingaporeSomaliaSouth AfricaSouth AmericaSouth Central AsiaSouth Eastern AsiaSouthern EuropeSpainSri LankaSt. Vincent and the GrenadinesSudanSwedenSwitzerlandSyriaTaiwanThailandTrinidad and TobagoTurkeyUgandaUkraineUruguayUzbekistanVenezuelaVietnamWest IndiesWestern AfricaWestern AsiaWestern EuropeYemenZaireZimbabweAzores
GED/Equivalency
Income
Poverty
Unemployment
Labor Participation
Family Structure
Vehicle Availability
Education Level
Disability

South African GED/Equivalency
Exceptional

87.5%
GED/EQUIVALENCY
98.3/ 100
METRIC RATING
83rd/ 347
METRIC RANK

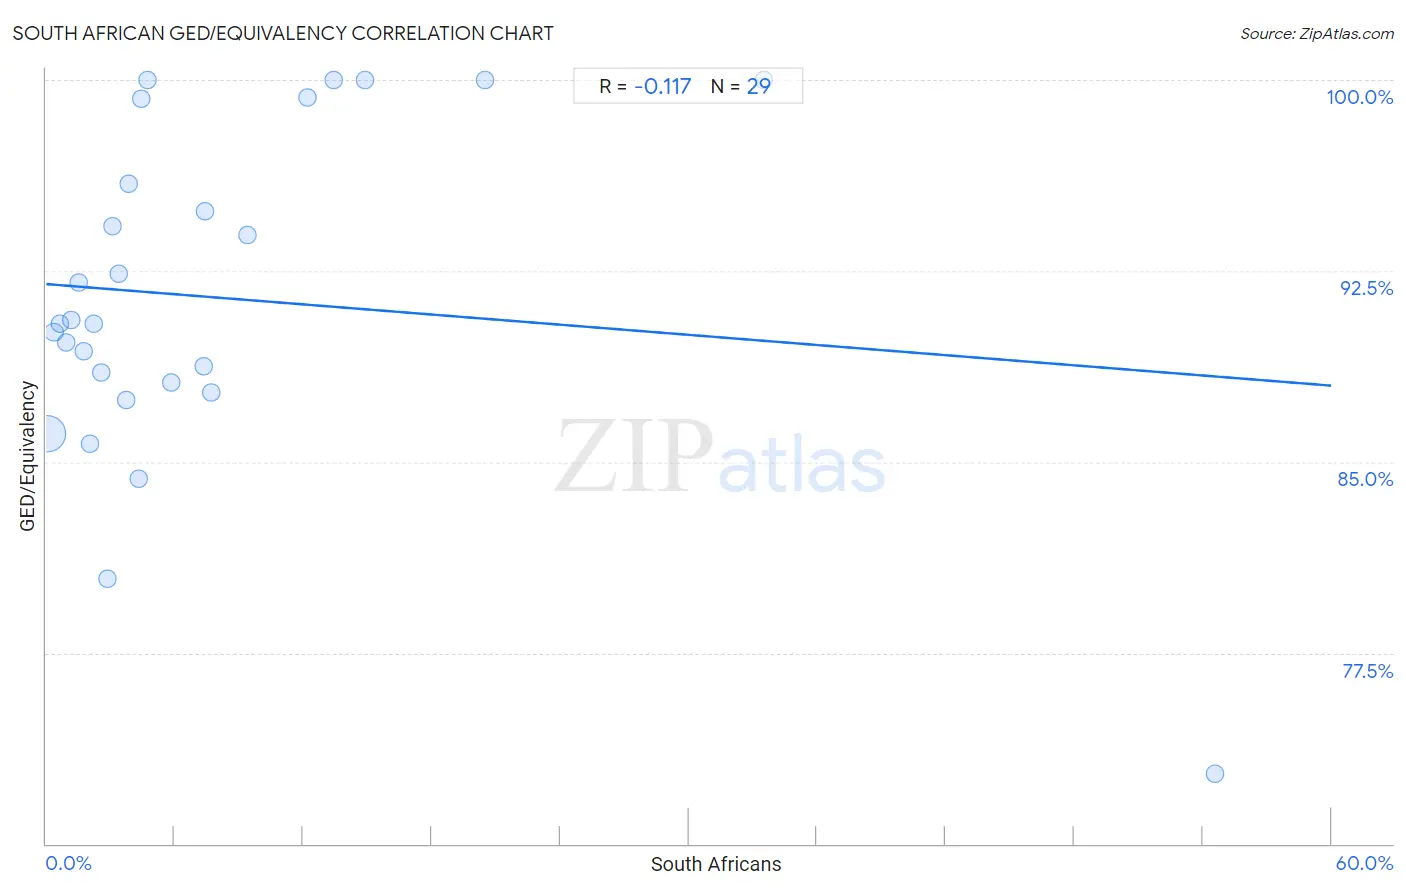
South African GED/Equivalency Correlation Chart

The statistical analysis conducted on geographies consisting of 182,604,532 people shows a poor negative correlation between the proportion of South Africans and percentage of population with at least ged/equivalency education in the United States with a correlation coefficient (R) of -0.117 and weighted average of 87.5%. On average, for every 1% (one percent) increase in South Africans within a typical geography, there is a decrease of 0.067% in percentage of population with at least ged/equivalency education.
South African GED/Equivalency
It is essential to understand that the correlation between the percentage of South Africans and percentage of population with at least ged/equivalency education does not imply a direct cause-and-effect relationship. It remains uncertain whether the presence of South Africans influences an upward or downward trend in the level of percentage of population with at least ged/equivalency education within an area, or if South Africans simply ended up residing in those areas with higher or lower levels of percentage of population with at least ged/equivalency education due to other factors.

Demographics Similar to South Africans by GED/Equivalency

In terms of ged/equivalency, the demographic groups most similar to South Africans are Immigrants from Sri Lanka (87.5%, a difference of 0.010%), Romanian (87.5%, a difference of 0.010%), Immigrants from Romania (87.5%, a difference of 0.040%), Dutch (87.5%, a difference of 0.040%), and Immigrants from England (87.6%, a difference of 0.050%).
DemographicsRating | RankGED/Equivalency
Immigrants from Serbia
98.7
/100
|
#76
Exceptional
87.7%
Slavs
98.7
/100
|
#77
Exceptional
87.7%
Irish
98.6
/100
|
#78
Exceptional
87.6%
English
98.6
/100
|
#79
Exceptional
87.6%
Immigrants from England
98.5
/100
|
#80
Exceptional
87.6%
Immigrants from Sri Lanka
98.3
/100
|
#81
Exceptional
87.5%
Romanians
98.3
/100
|
#82
Exceptional
87.5%
South Africans
98.3
/100
|
#83
Exceptional
87.5%
Immigrants from Romania
98.1
/100
|
#84
Exceptional
87.5%
Dutch
98.1
/100
|
#85
Exceptional
87.5%
Immigrants from Europe
98.1
/100
|
#86
Exceptional
87.5%
Native Hawaiians
98.1
/100
|
#87
Exceptional
87.5%
Immigrants from Norway
98.1
/100
|
#88
Exceptional
87.5%
Hungarians
97.9
/100
|
#89
Exceptional
87.4%
Welsh
97.9
/100
|
#90
Exceptional
87.4%

South African GED/Equivalency Correlation Summary

MeasurementSouth African DataGED/Equivalency Data
Minimum0.053%72.7%
Maximum54.5%100.0%
Range54.5%27.3%
Mean7.9%91.5%
Median3.8%90.4%
Interquartile 25% (IQ1)1.9%87.9%
Interquartile 75% (IQ3)8.5%97.6%
Interquartile Range (IQR)6.6%9.7%
Standard Deviation (Sample)11.5%6.5%
Standard Deviation (Population)11.3%6.4%

Correlation Details

South African PercentileSample SizeGED/Equivalency
[
0.0%
-
0.5%
]
0.053%
173,922,02686.1%
[
0.0%
-
0.5%
]
0.36%
5,959,14190.1%
[
0.5%
-
1.0%
]
0.66%
1,548,28090.4%
[
0.5%
-
1.0%
]
0.95%
553,07789.7%
[
1.0%
-
1.5%
]
1.18%
173,50390.5%
[
1.0%
-
1.5%
]
1.50%
149,49592.1%
[
1.5%
-
2.0%
]
1.77%
70,03289.3%
[
2.0%
-
2.5%
]
2.04%
58,26885.7%
[
2.0%
-
2.5%
]
2.20%
22,49790.4%
[
2.5%
-
3.0%
]
2.59%
32,66888.5%
[
2.5%
-
3.0%
]
2.86%
21,57780.4%
[
3.0%
-
3.5%
]
3.08%
38,11494.2%
[
3.0%
-
3.5%
]
3.37%
4,71792.4%
[
3.5%
-
4.0%
]
3.73%
9,89087.4%
[
3.5%
-
4.0%
]
3.84%
26,49895.9%
[
4.0%
-
4.5%
]
4.34%
4,45084.4%
[
4.0%
-
4.5%
]
4.46%
3,54199.3%
[
4.5%
-
5.0%
]
4.74%
190100.0%
[
5.5%
-
6.0%
]
5.84%
37788.1%
[
7.0%
-
7.5%
]
7.33%
1,63888.8%
[
7.0%
-
7.5%
]
7.39%
1,84194.9%
[
7.5%
-
8.0%
]
7.69%
6587.7%
[
9.0%
-
9.5%
]
9.40%
75593.9%
[
12.0%
-
12.5%
]
12.18%
98599.3%
[
13.0%
-
13.5%
]
13.44%
253100.0%
[
14.5%
-
15.0%
]
14.89%
309100.0%
[
20.0%
-
20.5%
]
20.50%
161100.0%
[
33.5%
-
34.0%
]
33.53%
173100.0%
[
54.5%
-
55.0%
]
54.55%
1172.7%