South African Married-couple Households

COMPARE

South African
Race
Ancestry
AfghanAfricanAlaska NativeAlaskan AthabascanAlbanianAleutAlsatianAmericanApacheArabArapahoArgentineanArmenianAssyrian/Chaldean/SyriacAustralianAustrianBahamianBangladeshiBarbadianBasqueBelgianBelizeanBermudanBhutaneseBlackfeetBolivianBrazilianBritishBritish West IndianBulgarianBurmeseCajunCambodianCanadianCape VerdeanCarpatho RusynCelticCentral AmericanCentral American IndianCherokeeCheyenneChickasawChileanChineseChippewaChoctawColombianColvilleComancheCosta RicanCreeCreekCroatianCrowCubanCypriotCzechCzechoslovakianDanishDelawareDominicanDutchDutch West IndianEastern EuropeanEcuadorianEgyptianEnglishEstonianEthiopianEuropeanFijianFilipinoFinnishFrenchFrench American IndianFrench CanadianGermanGerman RussianGhanaianGreekGuamanian/ChamorroGuatemalanGuyaneseHaitianHmongHonduranHopiHoumaHungarianIcelanderIndian (Asian)IndonesianInupiatIranianIraqiIrishIroquoisIsraeliItalianJamaicanJapaneseJordanianKenyanKiowaKoreanLaotianLatvianLebaneseLiberianLithuanianLumbeeLuxembourgerMacedonianMalaysianMalteseMarshalleseMenomineeMexicanMexican American IndianMongolianMoroccanNative HawaiianNavajoNepaleseNew ZealanderNicaraguanNigerianNorthern EuropeanNorwegianOkinawanOsageOttawaPaiutePakistaniPalestinianPanamanianParaguayanPennsylvania GermanPeruvianPimaPolishPortuguesePotawatomiPuebloPuerto RicanPuget Sound SalishRomanianRussianSalvadoranSamoanScandinavianScotch-IrishScottishSeminoleSenegaleseSerbianShoshoneSierra LeoneanSiouxSlavicSlovakSloveneSomaliSouth AfricanSouth AmericanSouth American IndianSoviet UnionSpaniardSpanishSpanish AmericanSpanish American IndianSri LankanSubsaharan AfricanSudaneseSwedishSwissSyrianTaiwaneseThaiTlingit-HaidaTohono O'OdhamTonganTrinidadian and TobagonianTsimshianTurkishU.S. Virgin IslanderUgandanUkrainianUruguayanUteVenezuelanVietnameseWelshWest IndianYakamaYaquiYugoslavianYumanYup'ikZimbabwean
Immigration
NonimmigrantsImmigrantsAfghanistanAfricaAlbaniaArgentinaArmeniaAsiaAustraliaAustriaBahamasBangladeshBarbadosBelarusBelgiumBelizeBoliviaBosnia and HerzegovinaBrazilBulgariaBurma/MyanmarCabo VerdeCambodiaCameroonCanadaCaribbeanCentral AmericaChileChinaColombiaCongoCosta RicaCroatiaCubaCzechoslovakiaDenmarkDominicaDominican RepublicEastern AfricaEastern AsiaEastern EuropeEcuadorEgyptEl SalvadorEnglandEritreaEthiopiaEuropeFijiFranceGermanyGhanaGreeceGrenadaGuatemalaGuyanaHaitiHondurasHong KongHungaryIndiaIndonesiaIranIraqIrelandIsraelItalyJamaicaJapanJordanKazakhstanKenyaKoreaKuwaitLaosLatin AmericaLatviaLebanonLiberiaLithuaniaMalaysiaMexicoMicronesiaMiddle AfricaMoldovaMoroccoNepalNetherlandsNicaraguaNigeriaNorth AmericaNorth MacedoniaNorthern AfricaNorthern EuropeNorwayOceaniaPakistanPanamaPeruPhilippinesPolandPortugalRomaniaRussiaSaudi ArabiaScotlandSenegalSerbiaSierra LeoneSingaporeSomaliaSouth AfricaSouth AmericaSouth Central AsiaSouth Eastern AsiaSouthern EuropeSpainSri LankaSt. Vincent and the GrenadinesSudanSwedenSwitzerlandSyriaTaiwanThailandTrinidad and TobagoTurkeyUgandaUkraineUruguayUzbekistanVenezuelaVietnamWest IndiesWestern AfricaWestern AsiaWestern EuropeYemenZaireZimbabweAzores
Select to Compare
Race
Ancestry
AfghanAfricanAlaska NativeAlaskan AthabascanAlbanianAleutAlsatianAmericanApacheArabArapahoArgentineanArmenianAssyrian/Chaldean/SyriacAustralianAustrianBahamianBangladeshiBarbadianBasqueBelgianBelizeanBermudanBhutaneseBlackfeetBolivianBrazilianBritishBritish West IndianBulgarianBurmeseCajunCambodianCanadianCape VerdeanCarpatho RusynCelticCentral AmericanCentral American IndianCherokeeCheyenneChickasawChileanChineseChippewaChoctawColombianColvilleComancheCosta RicanCreeCreekCroatianCrowCubanCypriotCzechCzechoslovakianDanishDelawareDominicanDutchDutch West IndianEastern EuropeanEcuadorianEgyptianEnglishEstonianEthiopianEuropeanFijianFilipinoFinnishFrenchFrench American IndianFrench CanadianGermanGerman RussianGhanaianGreekGuamanian/ChamorroGuatemalanGuyaneseHaitianHmongHonduranHopiHoumaHungarianIcelanderIndian (Asian)IndonesianInupiatIranianIraqiIrishIroquoisIsraeliItalianJamaicanJapaneseJordanianKenyanKiowaKoreanLaotianLatvianLebaneseLiberianLithuanianLumbeeLuxembourgerMacedonianMalaysianMalteseMarshalleseMenomineeMexicanMexican American IndianMongolianMoroccanNative HawaiianNavajoNepaleseNew ZealanderNicaraguanNigerianNorthern EuropeanNorwegianOkinawanOsageOttawaPaiutePakistaniPalestinianPanamanianParaguayanPennsylvania GermanPeruvianPimaPolishPortuguesePotawatomiPuebloPuerto RicanPuget Sound SalishRomanianRussianSalvadoranSamoanScandinavianScotch-IrishScottishSeminoleSenegaleseSerbianShoshoneSierra LeoneanSiouxSlavicSlovakSloveneSomaliSouth AmericanSouth American IndianSoviet UnionSpaniardSpanishSpanish AmericanSpanish American IndianSri LankanSubsaharan AfricanSudaneseSwedishSwissSyrianTaiwaneseThaiTlingit-HaidaTohono O'OdhamTonganTrinidadian and TobagonianTsimshianTurkishU.S. Virgin IslanderUgandanUkrainianUruguayanUteVenezuelanVietnameseWelshWest IndianYakamaYaquiYugoslavianYumanYup'ikZimbabwean
Immigration
NonimmigrantsImmigrantsAfghanistanAfricaAlbaniaArgentinaArmeniaAsiaAustraliaAustriaBahamasBangladeshBarbadosBelarusBelgiumBelizeBoliviaBosnia and HerzegovinaBrazilBulgariaBurma/MyanmarCabo VerdeCambodiaCameroonCanadaCaribbeanCentral AmericaChileChinaColombiaCongoCosta RicaCroatiaCubaCzechoslovakiaDenmarkDominicaDominican RepublicEastern AfricaEastern AsiaEastern EuropeEcuadorEgyptEl SalvadorEnglandEritreaEthiopiaEuropeFijiFranceGermanyGhanaGreeceGrenadaGuatemalaGuyanaHaitiHondurasHong KongHungaryIndiaIndonesiaIranIraqIrelandIsraelItalyJamaicaJapanJordanKazakhstanKenyaKoreaKuwaitLaosLatin AmericaLatviaLebanonLiberiaLithuaniaMalaysiaMexicoMicronesiaMiddle AfricaMoldovaMoroccoNepalNetherlandsNicaraguaNigeriaNorth AmericaNorth MacedoniaNorthern AfricaNorthern EuropeNorwayOceaniaPakistanPanamaPeruPhilippinesPolandPortugalRomaniaRussiaSaudi ArabiaScotlandSenegalSerbiaSierra LeoneSingaporeSomaliaSouth AfricaSouth AmericaSouth Central AsiaSouth Eastern AsiaSouthern EuropeSpainSri LankaSt. Vincent and the GrenadinesSudanSwedenSwitzerlandSyriaTaiwanThailandTrinidad and TobagoTurkeyUgandaUkraineUruguayUzbekistanVenezuelaVietnamWest IndiesWestern AfricaWestern AsiaWestern EuropeYemenZaireZimbabweAzores
Married-couple Households
Income
Poverty
Unemployment
Labor Participation
Family Structure
Vehicle Availability
Education Level
Disability

South African Married-couple Households
Excellent

47.3%
MARRIED-COUPLE HOUSEHOLDS
86.4/ 100
METRIC RATING
133rd/ 347
METRIC RANK

South African Married-couple Households Correlation Chart

The statistical analysis conducted on geographies consisting of 182,537,045 people shows a poor positive correlation between the proportion of South Africans and percentage of married-couple family households in the United States with a correlation coefficient (R) of 0.126 and weighted average of 47.3%. On average, for every 1% (one percent) increase in South Africans within a typical geography, there is an increase of 0.18% in percentage of married-couple family households.
South African Married-couple Households
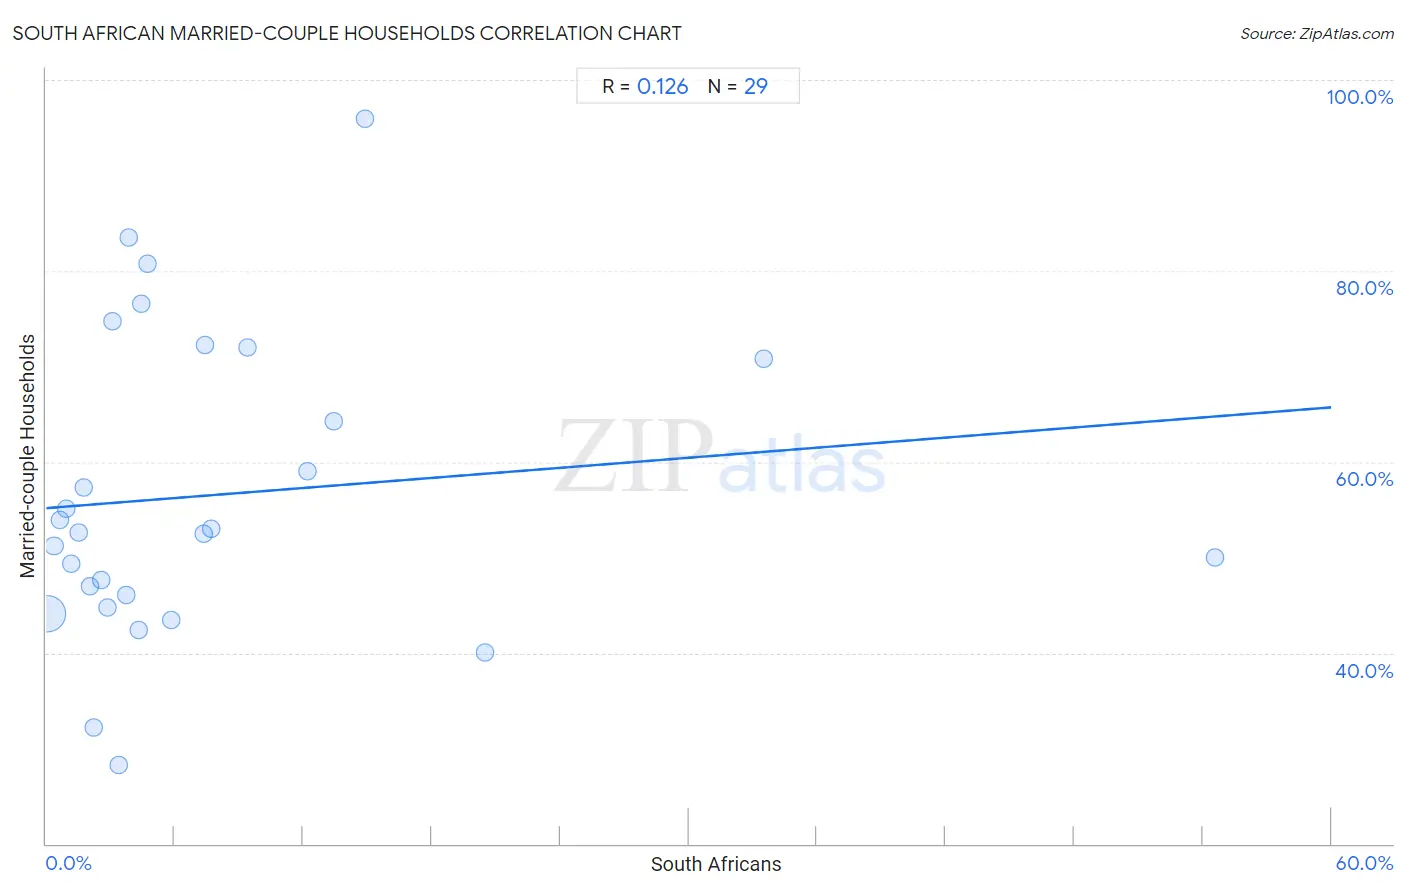
It is essential to understand that the correlation between the percentage of South Africans and percentage of married-couple family households does not imply a direct cause-and-effect relationship. It remains uncertain whether the presence of South Africans influences an upward or downward trend in the level of percentage of married-couple family households within an area, or if South Africans simply ended up residing in those areas with higher or lower levels of percentage of married-couple family households due to other factors.

Demographics Similar to South Africans by Married-couple Households

In terms of married-couple households, the demographic groups most similar to South Africans are Immigrants from Ukraine (47.3%, a difference of 0.020%), Immigrants from Greece (47.2%, a difference of 0.040%), Immigrants from Argentina (47.2%, a difference of 0.040%), Immigrants from Denmark (47.3%, a difference of 0.090%), and New Zealander (47.2%, a difference of 0.090%).
DemographicsRating | RankMarried-couple Households
Pakistanis
88.6
/100
|
#126
Excellent
47.3%
Celtics
88.1
/100
|
#127
Excellent
47.3%
Immigrants from Peru
87.9
/100
|
#128
Excellent
47.3%
Immigrants from Iraq
87.8
/100
|
#129
Excellent
47.3%
Immigrants from Hungary
87.8
/100
|
#130
Excellent
47.3%
Immigrants from Denmark
87.5
/100
|
#131
Excellent
47.3%
Immigrants from Ukraine
86.7
/100
|
#132
Excellent
47.3%
South Africans
86.4
/100
|
#133
Excellent
47.3%
Immigrants from Greece
86.0
/100
|
#134
Excellent
47.2%
Immigrants from Argentina
86.0
/100
|
#135
Excellent
47.2%
New Zealanders
85.3
/100
|
#136
Excellent
47.2%
Immigrants from Malaysia
85.2
/100
|
#137
Excellent
47.2%
Immigrants from Afghanistan
85.1
/100
|
#138
Excellent
47.2%
Immigrants from Sweden
84.7
/100
|
#139
Excellent
47.2%
Spanish
84.5
/100
|
#140
Excellent
47.2%

South African Married-couple Households Correlation Summary

MeasurementSouth African DataMarried-couple Households Data
Minimum0.053%28.3%
Maximum54.5%96.0%
Range54.5%67.7%
Mean7.9%56.6%
Median3.8%52.6%
Interquartile 25% (IQ1)1.9%45.4%
Interquartile 75% (IQ3)8.5%71.4%
Interquartile Range (IQR)6.6%26.0%
Standard Deviation (Sample)11.5%16.0%
Standard Deviation (Population)11.3%15.7%

Correlation Details

South African PercentileSample SizeMarried-couple Households
[
0.0%
-
0.5%
]
0.053%
173,879,90444.1%
[
0.0%
-
0.5%
]
0.36%
5,946,47751.2%
[
0.5%
-
1.0%
]
0.66%
1,547,62353.9%
[
0.5%
-
1.0%
]
0.95%
542,06155.0%
[
1.0%
-
1.5%
]
1.18%
173,50349.3%
[
1.0%
-
1.5%
]
1.50%
149,49552.6%
[
1.5%
-
2.0%
]
1.77%
69,80857.3%
[
2.0%
-
2.5%
]
2.04%
58,26847.0%
[
2.0%
-
2.5%
]
2.20%
21,69332.2%
[
2.5%
-
3.0%
]
2.59%
32,66847.6%
[
2.5%
-
3.0%
]
2.86%
21,57744.8%
[
3.0%
-
3.5%
]
3.08%
38,11474.7%
[
3.0%
-
3.5%
]
3.37%
4,71728.3%
[
3.5%
-
4.0%
]
3.73%
9,89046.0%
[
3.5%
-
4.0%
]
3.84%
26,49883.5%
[
4.0%
-
4.5%
]
4.34%
4,45042.4%
[
4.0%
-
4.5%
]
4.46%
3,54176.6%
[
4.5%
-
5.0%
]
4.74%
19080.8%
[
5.5%
-
6.0%
]
5.84%
37743.4%
[
7.0%
-
7.5%
]
7.33%
1,63852.5%
[
7.0%
-
7.5%
]
7.39%
1,84172.2%
[
7.5%
-
8.0%
]
7.69%
6552.9%
[
9.0%
-
9.5%
]
9.40%
75572.0%
[
12.0%
-
12.5%
]
12.18%
98559.0%
[
13.0%
-
13.5%
]
13.44%
25364.3%
[
14.5%
-
15.0%
]
14.89%
30996.0%
[
20.0%
-
20.5%
]
20.50%
16140.0%
[
33.5%
-
34.0%
]
33.53%
17370.8%
[
54.5%
-
55.0%
]
54.55%
1150.0%