South African 1 or more Vehicles in Household

COMPARE

South African
Race
Ancestry
AfghanAfricanAlaska NativeAlaskan AthabascanAlbanianAleutAlsatianAmericanApacheArabArapahoArgentineanArmenianAssyrian/Chaldean/SyriacAustralianAustrianBahamianBangladeshiBarbadianBasqueBelgianBelizeanBermudanBhutaneseBlackfeetBolivianBrazilianBritishBritish West IndianBulgarianBurmeseCajunCambodianCanadianCape VerdeanCarpatho RusynCelticCentral AmericanCentral American IndianCherokeeCheyenneChickasawChileanChineseChippewaChoctawColombianColvilleComancheCosta RicanCreeCreekCroatianCrowCubanCypriotCzechCzechoslovakianDanishDelawareDominicanDutchDutch West IndianEastern EuropeanEcuadorianEgyptianEnglishEstonianEthiopianEuropeanFijianFilipinoFinnishFrenchFrench American IndianFrench CanadianGermanGerman RussianGhanaianGreekGuamanian/ChamorroGuatemalanGuyaneseHaitianHmongHonduranHopiHoumaHungarianIcelanderIndian (Asian)IndonesianInupiatIranianIraqiIrishIroquoisIsraeliItalianJamaicanJapaneseJordanianKenyanKiowaKoreanLaotianLatvianLebaneseLiberianLithuanianLumbeeLuxembourgerMacedonianMalaysianMalteseMarshalleseMenomineeMexicanMexican American IndianMongolianMoroccanNative HawaiianNavajoNepaleseNew ZealanderNicaraguanNigerianNorthern EuropeanNorwegianOkinawanOsageOttawaPaiutePakistaniPalestinianPanamanianParaguayanPennsylvania GermanPeruvianPimaPolishPortuguesePotawatomiPuebloPuerto RicanPuget Sound SalishRomanianRussianSalvadoranSamoanScandinavianScotch-IrishScottishSeminoleSenegaleseSerbianShoshoneSierra LeoneanSiouxSlavicSlovakSloveneSomaliSouth AfricanSouth AmericanSouth American IndianSoviet UnionSpaniardSpanishSpanish AmericanSpanish American IndianSri LankanSubsaharan AfricanSudaneseSwedishSwissSyrianTaiwaneseThaiTlingit-HaidaTohono O'OdhamTonganTrinidadian and TobagonianTsimshianTurkishU.S. Virgin IslanderUgandanUkrainianUruguayanUteVenezuelanVietnameseWelshWest IndianYakamaYaquiYugoslavianYumanYup'ikZimbabwean
Immigration
NonimmigrantsImmigrantsAfghanistanAfricaAlbaniaArgentinaArmeniaAsiaAustraliaAustriaBahamasBangladeshBarbadosBelarusBelgiumBelizeBoliviaBosnia and HerzegovinaBrazilBulgariaBurma/MyanmarCabo VerdeCambodiaCameroonCanadaCaribbeanCentral AmericaChileChinaColombiaCongoCosta RicaCroatiaCubaCzechoslovakiaDenmarkDominicaDominican RepublicEastern AfricaEastern AsiaEastern EuropeEcuadorEgyptEl SalvadorEnglandEritreaEthiopiaEuropeFijiFranceGermanyGhanaGreeceGrenadaGuatemalaGuyanaHaitiHondurasHong KongHungaryIndiaIndonesiaIranIraqIrelandIsraelItalyJamaicaJapanJordanKazakhstanKenyaKoreaKuwaitLaosLatin AmericaLatviaLebanonLiberiaLithuaniaMalaysiaMexicoMicronesiaMiddle AfricaMoldovaMoroccoNepalNetherlandsNicaraguaNigeriaNorth AmericaNorth MacedoniaNorthern AfricaNorthern EuropeNorwayOceaniaPakistanPanamaPeruPhilippinesPolandPortugalRomaniaRussiaSaudi ArabiaScotlandSenegalSerbiaSierra LeoneSingaporeSomaliaSouth AfricaSouth AmericaSouth Central AsiaSouth Eastern AsiaSouthern EuropeSpainSri LankaSt. Vincent and the GrenadinesSudanSwedenSwitzerlandSyriaTaiwanThailandTrinidad and TobagoTurkeyUgandaUkraineUruguayUzbekistanVenezuelaVietnamWest IndiesWestern AfricaWestern AsiaWestern EuropeYemenZaireZimbabweAzores
Select to Compare
Race
Ancestry
AfghanAfricanAlaska NativeAlaskan AthabascanAlbanianAleutAlsatianAmericanApacheArabArapahoArgentineanArmenianAssyrian/Chaldean/SyriacAustralianAustrianBahamianBangladeshiBarbadianBasqueBelgianBelizeanBermudanBhutaneseBlackfeetBolivianBrazilianBritishBritish West IndianBulgarianBurmeseCajunCambodianCanadianCape VerdeanCarpatho RusynCelticCentral AmericanCentral American IndianCherokeeCheyenneChickasawChileanChineseChippewaChoctawColombianColvilleComancheCosta RicanCreeCreekCroatianCrowCubanCypriotCzechCzechoslovakianDanishDelawareDominicanDutchDutch West IndianEastern EuropeanEcuadorianEgyptianEnglishEstonianEthiopianEuropeanFijianFilipinoFinnishFrenchFrench American IndianFrench CanadianGermanGerman RussianGhanaianGreekGuamanian/ChamorroGuatemalanGuyaneseHaitianHmongHonduranHopiHoumaHungarianIcelanderIndian (Asian)IndonesianInupiatIranianIraqiIrishIroquoisIsraeliItalianJamaicanJapaneseJordanianKenyanKiowaKoreanLaotianLatvianLebaneseLiberianLithuanianLumbeeLuxembourgerMacedonianMalaysianMalteseMarshalleseMenomineeMexicanMexican American IndianMongolianMoroccanNative HawaiianNavajoNepaleseNew ZealanderNicaraguanNigerianNorthern EuropeanNorwegianOkinawanOsageOttawaPaiutePakistaniPalestinianPanamanianParaguayanPennsylvania GermanPeruvianPimaPolishPortuguesePotawatomiPuebloPuerto RicanPuget Sound SalishRomanianRussianSalvadoranSamoanScandinavianScotch-IrishScottishSeminoleSenegaleseSerbianShoshoneSierra LeoneanSiouxSlavicSlovakSloveneSomaliSouth AmericanSouth American IndianSoviet UnionSpaniardSpanishSpanish AmericanSpanish American IndianSri LankanSubsaharan AfricanSudaneseSwedishSwissSyrianTaiwaneseThaiTlingit-HaidaTohono O'OdhamTonganTrinidadian and TobagonianTsimshianTurkishU.S. Virgin IslanderUgandanUkrainianUruguayanUteVenezuelanVietnameseWelshWest IndianYakamaYaquiYugoslavianYumanYup'ikZimbabwean
Immigration
NonimmigrantsImmigrantsAfghanistanAfricaAlbaniaArgentinaArmeniaAsiaAustraliaAustriaBahamasBangladeshBarbadosBelarusBelgiumBelizeBoliviaBosnia and HerzegovinaBrazilBulgariaBurma/MyanmarCabo VerdeCambodiaCameroonCanadaCaribbeanCentral AmericaChileChinaColombiaCongoCosta RicaCroatiaCubaCzechoslovakiaDenmarkDominicaDominican RepublicEastern AfricaEastern AsiaEastern EuropeEcuadorEgyptEl SalvadorEnglandEritreaEthiopiaEuropeFijiFranceGermanyGhanaGreeceGrenadaGuatemalaGuyanaHaitiHondurasHong KongHungaryIndiaIndonesiaIranIraqIrelandIsraelItalyJamaicaJapanJordanKazakhstanKenyaKoreaKuwaitLaosLatin AmericaLatviaLebanonLiberiaLithuaniaMalaysiaMexicoMicronesiaMiddle AfricaMoldovaMoroccoNepalNetherlandsNicaraguaNigeriaNorth AmericaNorth MacedoniaNorthern AfricaNorthern EuropeNorwayOceaniaPakistanPanamaPeruPhilippinesPolandPortugalRomaniaRussiaSaudi ArabiaScotlandSenegalSerbiaSierra LeoneSingaporeSomaliaSouth AfricaSouth AmericaSouth Central AsiaSouth Eastern AsiaSouthern EuropeSpainSri LankaSt. Vincent and the GrenadinesSudanSwedenSwitzerlandSyriaTaiwanThailandTrinidad and TobagoTurkeyUgandaUkraineUruguayUzbekistanVenezuelaVietnamWest IndiesWestern AfricaWestern AsiaWestern EuropeYemenZaireZimbabweAzores
1 or more Vehicles in Household
Income
Poverty
Unemployment
Labor Participation
Family Structure
Vehicle Availability
Education Level
Disability

South African 1 or more Vehicles in Household
Good

90.0%
1+ VEHICLES AVAILABLE
69.7/ 100
METRIC RATING
159th/ 347
METRIC RANK

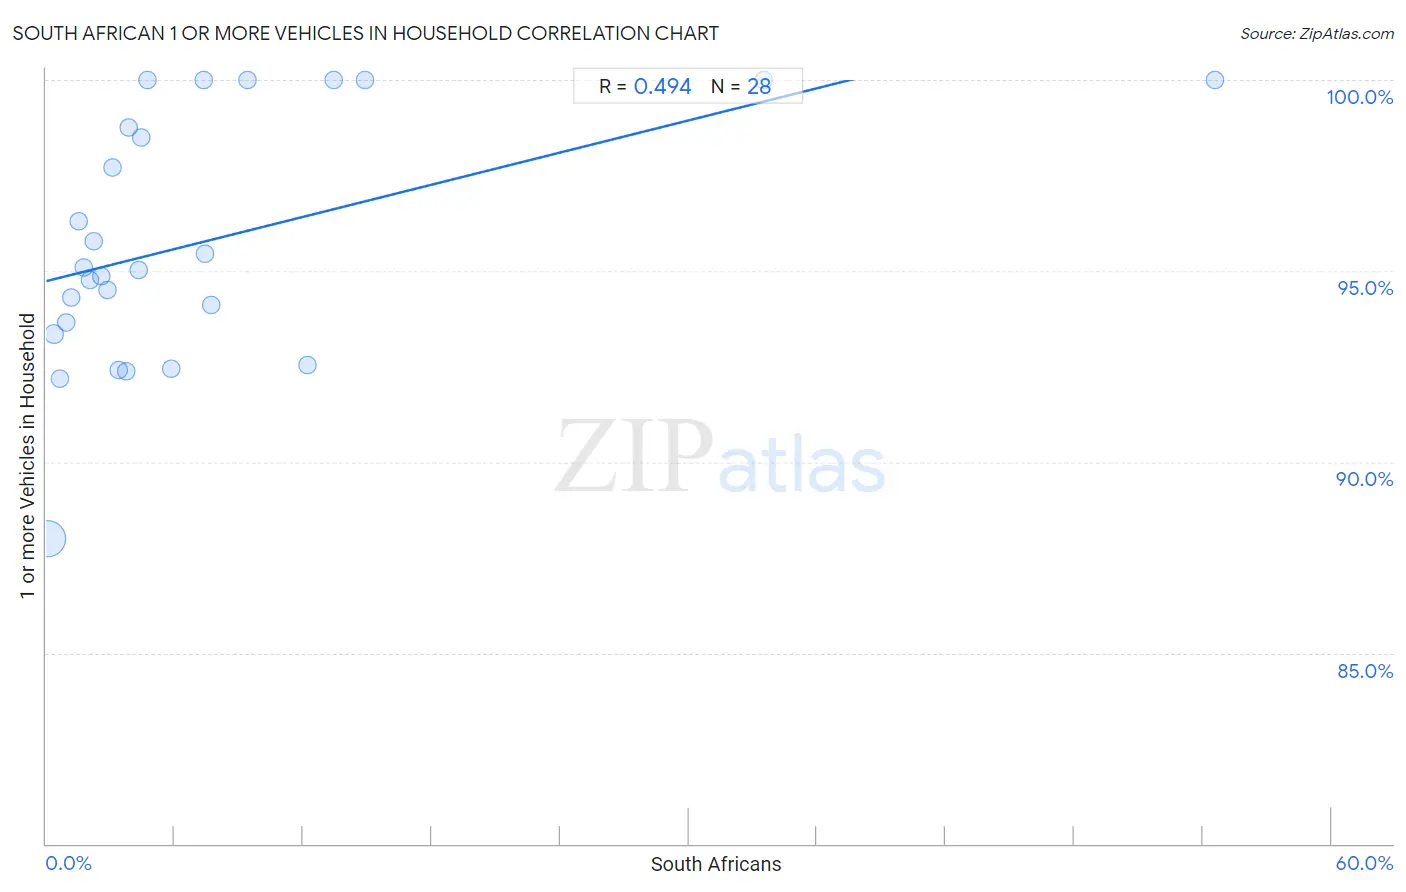
South African 1 or more Vehicles in Household Correlation Chart

The statistical analysis conducted on geographies consisting of 182,559,953 people shows a moderate positive correlation between the proportion of South Africans and percentage of households with 1 or more vehicles available in the United States with a correlation coefficient (R) of 0.494 and weighted average of 90.0%. On average, for every 1% (one percent) increase in South Africans within a typical geography, there is an increase of 0.14% in percentage of households with 1 or more vehicles available.
South African 1 or more Vehicles in Household
It is essential to understand that the correlation between the percentage of South Africans and percentage of households with 1 or more vehicles available does not imply a direct cause-and-effect relationship. It remains uncertain whether the presence of South Africans influences an upward or downward trend in the level of percentage of households with 1 or more vehicles available within an area, or if South Africans simply ended up residing in those areas with higher or lower levels of percentage of households with 1 or more vehicles available due to other factors.

Demographics Similar to South Africans by 1 or more Vehicles in Household

In terms of 1 or more vehicles in household, the demographic groups most similar to South Africans are Brazilian (90.0%, a difference of 0.020%), Immigrants from Indonesia (90.0%, a difference of 0.020%), Salvadoran (90.0%, a difference of 0.020%), Immigrants from Congo (90.0%, a difference of 0.030%), and Australian (90.0%, a difference of 0.050%).
DemographicsRating | Rank1 or more Vehicles in Household
Tlingit-Haida
74.3
/100
|
#152
Good
90.1%
New Zealanders
73.8
/100
|
#153
Good
90.1%
Immigrants from Uganda
73.8
/100
|
#154
Good
90.1%
Immigrants
73.6
/100
|
#155
Good
90.1%
Australians
72.4
/100
|
#156
Good
90.0%
Immigrants from Congo
71.2
/100
|
#157
Good
90.0%
Brazilians
71.0
/100
|
#158
Good
90.0%
South Africans
69.7
/100
|
#159
Good
90.0%
Immigrants from Indonesia
68.8
/100
|
#160
Good
90.0%
Salvadorans
68.7
/100
|
#161
Good
90.0%
Spanish American Indians
67.0
/100
|
#162
Good
89.9%
Immigrants from Austria
65.5
/100
|
#163
Good
89.9%
Comanche
63.4
/100
|
#164
Good
89.9%
Immigrants from Saudi Arabia
62.6
/100
|
#165
Good
89.9%
Immigrants from Middle Africa
62.2
/100
|
#166
Good
89.9%

South African 1 or more Vehicles in Household Correlation Summary

MeasurementSouth African Data1 or more Vehicles in Household Data
Minimum0.053%88.0%
Maximum54.5%100.0%
Range54.5%12.0%
Mean7.5%95.8%
Median3.8%95.1%
Interquartile 25% (IQ1)1.9%93.5%
Interquartile 75% (IQ3)7.5%99.4%
Interquartile Range (IQR)5.6%5.9%
Standard Deviation (Sample)11.4%3.2%
Standard Deviation (Population)11.2%3.2%

Correlation Details

South African PercentileSample Size1 or more Vehicles in Household
[
0.0%
-
0.5%
]
0.053%
173,901,29788.0%
[
0.0%
-
0.5%
]
0.36%
5,947,47393.3%
[
0.5%
-
1.0%
]
0.66%
1,547,62392.2%
[
0.5%
-
1.0%
]
0.95%
542,74193.6%
[
1.0%
-
1.5%
]
1.18%
173,50394.3%
[
1.0%
-
1.5%
]
1.50%
149,49596.3%
[
1.5%
-
2.0%
]
1.77%
69,80895.1%
[
2.0%
-
2.5%
]
2.04%
58,26894.8%
[
2.0%
-
2.5%
]
2.20%
21,69395.8%
[
2.5%
-
3.0%
]
2.59%
32,66894.9%
[
2.5%
-
3.0%
]
2.86%
21,57794.5%
[
3.0%
-
3.5%
]
3.08%
38,11497.7%
[
3.0%
-
3.5%
]
3.37%
4,71792.4%
[
3.5%
-
4.0%
]
3.73%
9,89092.4%
[
3.5%
-
4.0%
]
3.84%
26,49898.8%
[
4.0%
-
4.5%
]
4.34%
4,45095.0%
[
4.0%
-
4.5%
]
4.46%
3,54198.5%
[
4.5%
-
5.0%
]
4.74%
190100.0%
[
5.5%
-
6.0%
]
5.84%
37792.5%
[
7.0%
-
7.5%
]
7.33%
1,638100.0%
[
7.0%
-
7.5%
]
7.39%
1,84195.4%
[
7.5%
-
8.0%
]
7.69%
6594.1%
[
9.0%
-
9.5%
]
9.40%
755100.0%
[
12.0%
-
12.5%
]
12.18%
98592.5%
[
13.0%
-
13.5%
]
13.44%
253100.0%
[
14.5%
-
15.0%
]
14.89%
309100.0%
[
33.5%
-
34.0%
]
33.53%
173100.0%
[
54.5%
-
55.0%
]
54.55%
11100.0%