South African Disability Age Under 5
COMPARE
South African
Select to Compare
Disability Age Under 5
South African Disability Age Under 5
1.1%
DISABILITY | AGE UNDER 5
98.7/ 100
METRIC RATING
68th/ 347
METRIC RANK
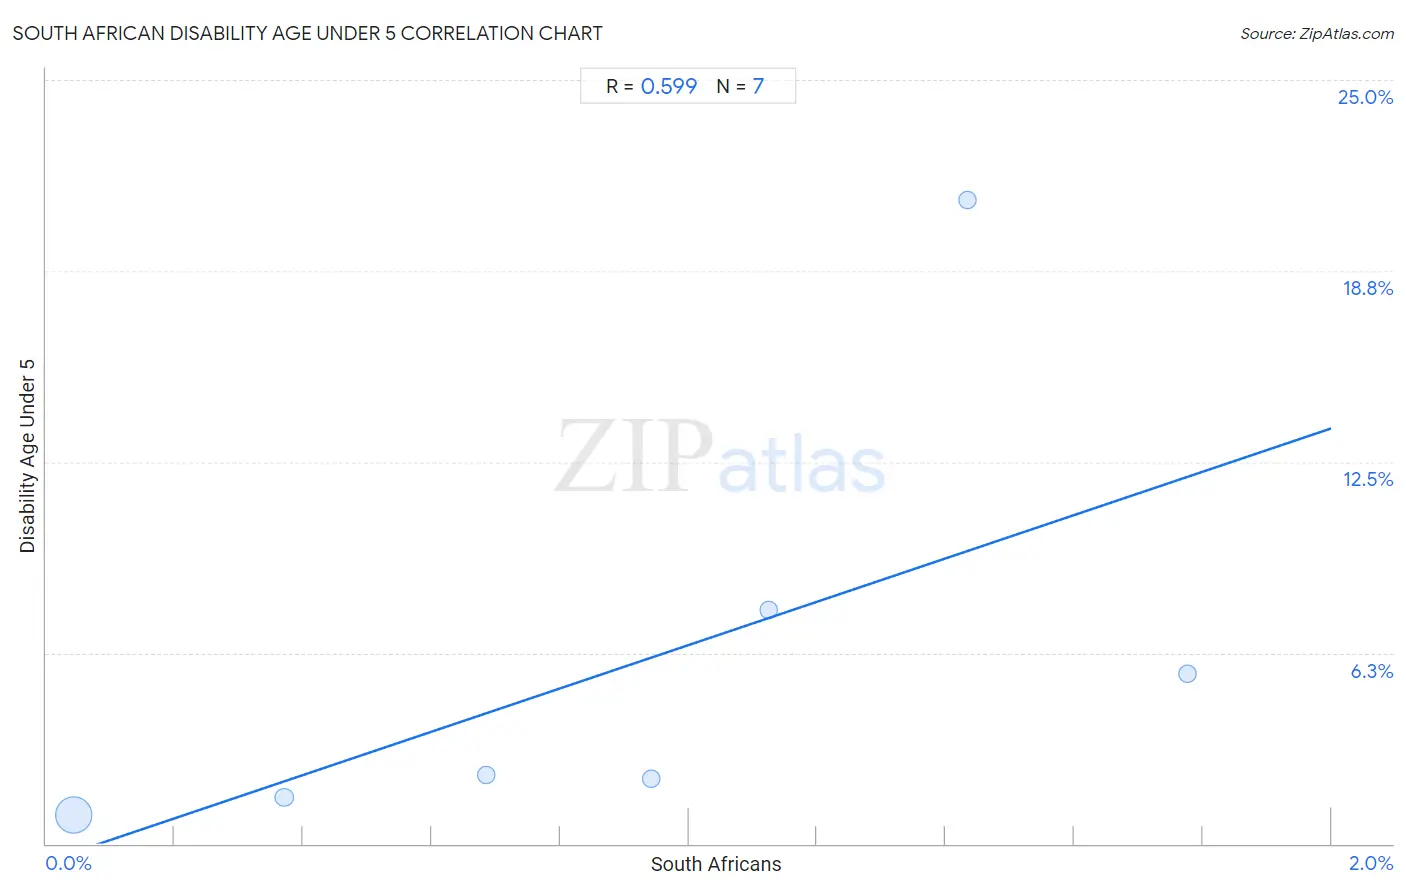
South African Disability Age Under 5 Correlation Chart
The statistical analysis conducted on geographies consisting of 120,529,150 people shows a substantial positive correlation between the proportion of South Africans and percentage of population with a disability under the age of 5 in the United States with a correlation coefficient (R) of 0.599 and weighted average of 1.1%. On average, for every 1% (one percent) increase in South Africans within a typical geography, there is an increase of 7.1% in percentage of population with a disability under the age of 5.
It is essential to understand that the correlation between the percentage of South Africans and percentage of population with a disability under the age of 5 does not imply a direct cause-and-effect relationship. It remains uncertain whether the presence of South Africans influences an upward or downward trend in the level of percentage of population with a disability under the age of 5 within an area, or if South Africans simply ended up residing in those areas with higher or lower levels of percentage of population with a disability under the age of 5 due to other factors.
Demographics Similar to South Africans by Disability Age Under 5
In terms of disability age under 5, the demographic groups most similar to South Africans are Israeli (1.1%, a difference of 0.030%), Immigrants from Belize (1.1%, a difference of 0.040%), Immigrants from Indonesia (1.1%, a difference of 0.10%), Immigrants from Ecuador (1.1%, a difference of 0.11%), and Trinidadian and Tobagonian (1.1%, a difference of 0.17%).
| Demographics | Rating | Rank | Disability Age Under 5 |
| Immigrants from Ethiopia | 99.2 /100 | #61 | Exceptional 1.1% |
| Immigrants from Switzerland | 99.2 /100 | #62 | Exceptional 1.1% |
| Immigrants from Vietnam | 99.1 /100 | #63 | Exceptional 1.1% |
| Egyptians | 98.9 /100 | #64 | Exceptional 1.1% |
| Immigrants from Korea | 98.8 /100 | #65 | Exceptional 1.1% |
| Immigrants from Indonesia | 98.7 /100 | #66 | Exceptional 1.1% |
| Immigrants from Belize | 98.7 /100 | #67 | Exceptional 1.1% |
| South Africans | 98.7 /100 | #68 | Exceptional 1.1% |
| Israelis | 98.7 /100 | #69 | Exceptional 1.1% |
| Immigrants from Ecuador | 98.6 /100 | #70 | Exceptional 1.1% |
| Trinidadians and Tobagonians | 98.6 /100 | #71 | Exceptional 1.1% |
| Burmese | 98.5 /100 | #72 | Exceptional 1.1% |
| Immigrants from Sri Lanka | 98.5 /100 | #73 | Exceptional 1.1% |
| Jordanians | 98.5 /100 | #74 | Exceptional 1.1% |
| Immigrants from Pakistan | 98.4 /100 | #75 | Exceptional 1.1% |
South African Disability Age Under 5 Correlation Summary
| Measurement | South African Data | Disability Age Under 5 Data |
| Minimum | 0.043% | 0.96% |
| Maximum | 1.8% | 21.1% |
| Range | 1.7% | 20.1% |
| Mean | 0.91% | 5.9% |
| Median | 0.94% | 2.3% |
| Interquartile 25% (IQ1) | 0.37% | 1.5% |
| Interquartile 75% (IQ3) | 1.4% | 7.7% |
| Interquartile Range (IQR) | 1.1% | 6.1% |
| Standard Deviation (Sample) | 0.60% | 7.1% |
| Standard Deviation (Population) | 0.56% | 6.6% |
Correlation Details
| South African Percentile | Sample Size | Disability Age Under 5 |
[ 0.0% - 0.5% ] 0.043% | 118,556,068 | 0.96% |
[ 0.0% - 0.5% ] 0.37% | 1,437,076 | 1.5% |
[ 0.5% - 1.0% ] 0.68% | 363,214 | 2.3% |
[ 0.5% - 1.0% ] 0.94% | 151,598 | 2.1% |
[ 1.0% - 1.5% ] 1.13% | 13,597 | 7.7% |
[ 1.0% - 1.5% ] 1.43% | 279 | 21.1% |
[ 1.5% - 2.0% ] 1.78% | 7,318 | 5.6% |