Serbian Male Disability

COMPARE

Serbian
Race
Ancestry
AfghanAfricanAlaska NativeAlaskan AthabascanAlbanianAleutAlsatianAmericanApacheArabArapahoArgentineanArmenianAssyrian/Chaldean/SyriacAustralianAustrianBahamianBangladeshiBarbadianBasqueBelgianBelizeanBermudanBhutaneseBlackfeetBolivianBrazilianBritishBritish West IndianBulgarianBurmeseCajunCambodianCanadianCape VerdeanCarpatho RusynCelticCentral AmericanCentral American IndianCherokeeCheyenneChickasawChileanChineseChippewaChoctawColombianColvilleComancheCosta RicanCreeCreekCroatianCrowCubanCypriotCzechCzechoslovakianDanishDelawareDominicanDutchDutch West IndianEastern EuropeanEcuadorianEgyptianEnglishEstonianEthiopianEuropeanFijianFilipinoFinnishFrenchFrench American IndianFrench CanadianGermanGerman RussianGhanaianGreekGuamanian/ChamorroGuatemalanGuyaneseHaitianHmongHonduranHopiHoumaHungarianIcelanderIndian (Asian)IndonesianInupiatIranianIraqiIrishIroquoisIsraeliItalianJamaicanJapaneseJordanianKenyanKiowaKoreanLaotianLatvianLebaneseLiberianLithuanianLumbeeLuxembourgerMacedonianMalaysianMalteseMarshalleseMenomineeMexicanMexican American IndianMongolianMoroccanNative HawaiianNavajoNepaleseNew ZealanderNicaraguanNigerianNorthern EuropeanNorwegianOkinawanOsageOttawaPaiutePakistaniPalestinianPanamanianParaguayanPennsylvania GermanPeruvianPimaPolishPortuguesePotawatomiPuebloPuerto RicanPuget Sound SalishRomanianRussianSalvadoranSamoanScandinavianScotch-IrishScottishSeminoleSenegaleseSerbianShoshoneSierra LeoneanSiouxSlavicSlovakSloveneSomaliSouth AfricanSouth AmericanSouth American IndianSoviet UnionSpaniardSpanishSpanish AmericanSpanish American IndianSri LankanSubsaharan AfricanSudaneseSwedishSwissSyrianTaiwaneseThaiTlingit-HaidaTohono O'OdhamTonganTrinidadian and TobagonianTsimshianTurkishU.S. Virgin IslanderUgandanUkrainianUruguayanUteVenezuelanVietnameseWelshWest IndianYakamaYaquiYugoslavianYumanYup'ikZimbabwean
Immigration
NonimmigrantsImmigrantsAfghanistanAfricaAlbaniaArgentinaArmeniaAsiaAustraliaAustriaBahamasBangladeshBarbadosBelarusBelgiumBelizeBoliviaBosnia and HerzegovinaBrazilBulgariaBurma/MyanmarCabo VerdeCambodiaCameroonCanadaCaribbeanCentral AmericaChileChinaColombiaCongoCosta RicaCroatiaCubaCzechoslovakiaDenmarkDominicaDominican RepublicEastern AfricaEastern AsiaEastern EuropeEcuadorEgyptEl SalvadorEnglandEritreaEthiopiaEuropeFijiFranceGermanyGhanaGreeceGrenadaGuatemalaGuyanaHaitiHondurasHong KongHungaryIndiaIndonesiaIranIraqIrelandIsraelItalyJamaicaJapanJordanKazakhstanKenyaKoreaKuwaitLaosLatin AmericaLatviaLebanonLiberiaLithuaniaMalaysiaMexicoMicronesiaMiddle AfricaMoldovaMoroccoNepalNetherlandsNicaraguaNigeriaNorth AmericaNorth MacedoniaNorthern AfricaNorthern EuropeNorwayOceaniaPakistanPanamaPeruPhilippinesPolandPortugalRomaniaRussiaSaudi ArabiaScotlandSenegalSerbiaSierra LeoneSingaporeSomaliaSouth AfricaSouth AmericaSouth Central AsiaSouth Eastern AsiaSouthern EuropeSpainSri LankaSt. Vincent and the GrenadinesSudanSwedenSwitzerlandSyriaTaiwanThailandTrinidad and TobagoTurkeyUgandaUkraineUruguayUzbekistanVenezuelaVietnamWest IndiesWestern AfricaWestern AsiaWestern EuropeYemenZaireZimbabweAzores
Select to Compare
Race
Ancestry
AfghanAfricanAlaska NativeAlaskan AthabascanAlbanianAleutAlsatianAmericanApacheArabArapahoArgentineanArmenianAssyrian/Chaldean/SyriacAustralianAustrianBahamianBangladeshiBarbadianBasqueBelgianBelizeanBermudanBhutaneseBlackfeetBolivianBrazilianBritishBritish West IndianBulgarianBurmeseCajunCambodianCanadianCape VerdeanCarpatho RusynCelticCentral AmericanCentral American IndianCherokeeCheyenneChickasawChileanChineseChippewaChoctawColombianColvilleComancheCosta RicanCreeCreekCroatianCrowCubanCypriotCzechCzechoslovakianDanishDelawareDominicanDutchDutch West IndianEastern EuropeanEcuadorianEgyptianEnglishEstonianEthiopianEuropeanFijianFilipinoFinnishFrenchFrench American IndianFrench CanadianGermanGerman RussianGhanaianGreekGuamanian/ChamorroGuatemalanGuyaneseHaitianHmongHonduranHopiHoumaHungarianIcelanderIndian (Asian)IndonesianInupiatIranianIraqiIrishIroquoisIsraeliItalianJamaicanJapaneseJordanianKenyanKiowaKoreanLaotianLatvianLebaneseLiberianLithuanianLumbeeLuxembourgerMacedonianMalaysianMalteseMarshalleseMenomineeMexicanMexican American IndianMongolianMoroccanNative HawaiianNavajoNepaleseNew ZealanderNicaraguanNigerianNorthern EuropeanNorwegianOkinawanOsageOttawaPaiutePakistaniPalestinianPanamanianParaguayanPennsylvania GermanPeruvianPimaPolishPortuguesePotawatomiPuebloPuerto RicanPuget Sound SalishRomanianRussianSalvadoranSamoanScandinavianScotch-IrishScottishSeminoleSenegaleseShoshoneSierra LeoneanSiouxSlavicSlovakSloveneSomaliSouth AfricanSouth AmericanSouth American IndianSoviet UnionSpaniardSpanishSpanish AmericanSpanish American IndianSri LankanSubsaharan AfricanSudaneseSwedishSwissSyrianTaiwaneseThaiTlingit-HaidaTohono O'OdhamTonganTrinidadian and TobagonianTsimshianTurkishU.S. Virgin IslanderUgandanUkrainianUruguayanUteVenezuelanVietnameseWelshWest IndianYakamaYaquiYugoslavianYumanYup'ikZimbabwean
Immigration
NonimmigrantsImmigrantsAfghanistanAfricaAlbaniaArgentinaArmeniaAsiaAustraliaAustriaBahamasBangladeshBarbadosBelarusBelgiumBelizeBoliviaBosnia and HerzegovinaBrazilBulgariaBurma/MyanmarCabo VerdeCambodiaCameroonCanadaCaribbeanCentral AmericaChileChinaColombiaCongoCosta RicaCroatiaCubaCzechoslovakiaDenmarkDominicaDominican RepublicEastern AfricaEastern AsiaEastern EuropeEcuadorEgyptEl SalvadorEnglandEritreaEthiopiaEuropeFijiFranceGermanyGhanaGreeceGrenadaGuatemalaGuyanaHaitiHondurasHong KongHungaryIndiaIndonesiaIranIraqIrelandIsraelItalyJamaicaJapanJordanKazakhstanKenyaKoreaKuwaitLaosLatin AmericaLatviaLebanonLiberiaLithuaniaMalaysiaMexicoMicronesiaMiddle AfricaMoldovaMoroccoNepalNetherlandsNicaraguaNigeriaNorth AmericaNorth MacedoniaNorthern AfricaNorthern EuropeNorwayOceaniaPakistanPanamaPeruPhilippinesPolandPortugalRomaniaRussiaSaudi ArabiaScotlandSenegalSerbiaSierra LeoneSingaporeSomaliaSouth AfricaSouth AmericaSouth Central AsiaSouth Eastern AsiaSouthern EuropeSpainSri LankaSt. Vincent and the GrenadinesSudanSwedenSwitzerlandSyriaTaiwanThailandTrinidad and TobagoTurkeyUgandaUkraineUruguayUzbekistanVenezuelaVietnamWest IndiesWestern AfricaWestern AsiaWestern EuropeYemenZaireZimbabweAzores
Male Disability
Income
Poverty
Unemployment
Labor Participation
Family Structure
Vehicle Availability
Education Level
Disability

Serbian Male Disability
Poor

11.5%
DISABILITY | MALES
10.7/ 100
METRIC RATING
205th/ 347
METRIC RANK

Serbian Male Disability Correlation Chart

The statistical analysis conducted on geographies consisting of 267,640,230 people shows a weak positive correlation between the proportion of Serbians and percentage of males with a disability in the United States with a correlation coefficient (R) of 0.269 and weighted average of 11.5%. On average, for every 1% (one percent) increase in Serbians within a typical geography, there is an increase of 0.26% in percentage of males with a disability.
Serbian Male Disability
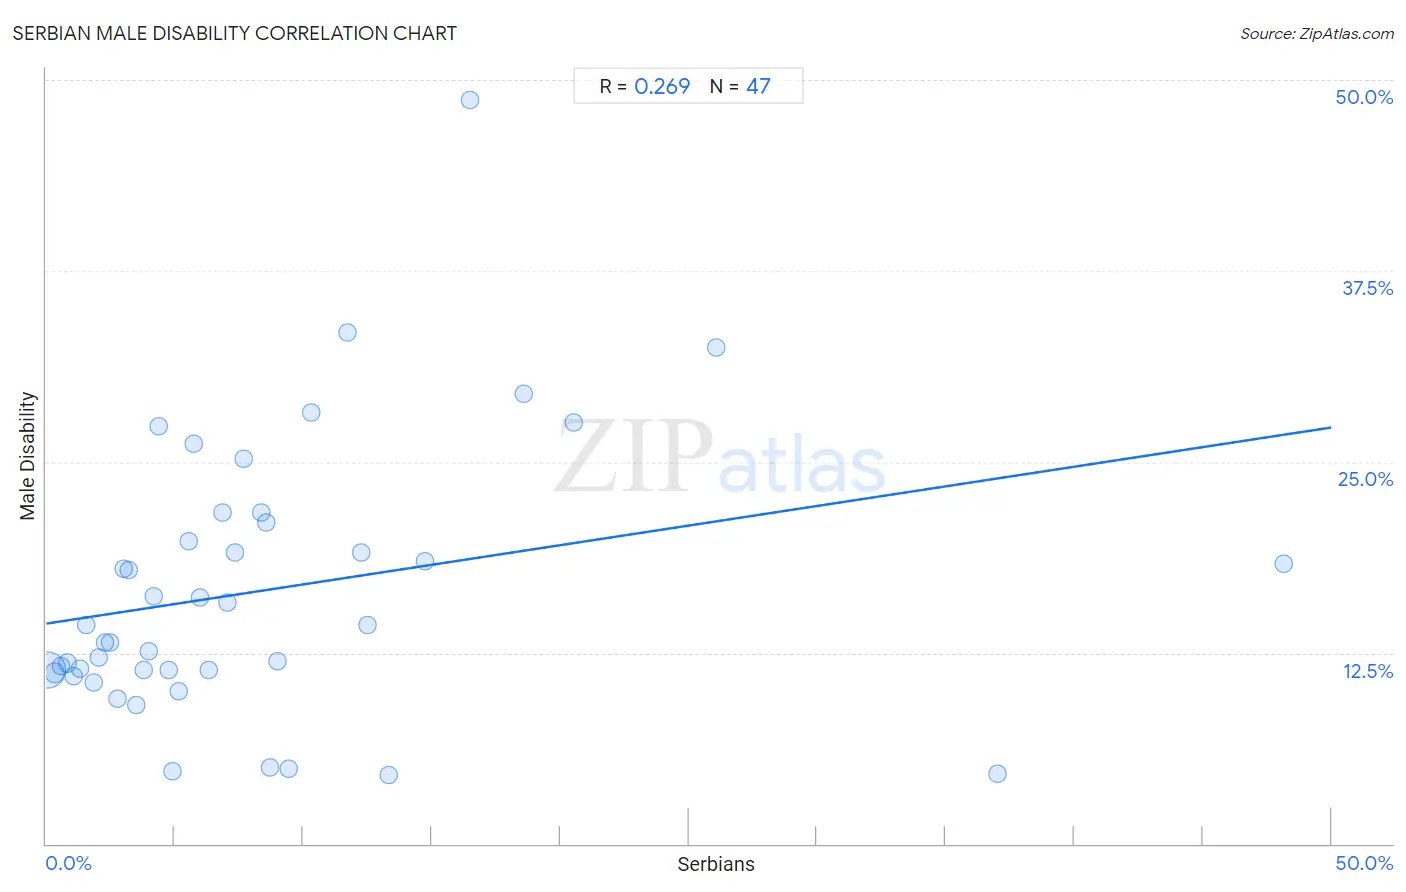
It is essential to understand that the correlation between the percentage of Serbians and percentage of males with a disability does not imply a direct cause-and-effect relationship. It remains uncertain whether the presence of Serbians influences an upward or downward trend in the level of percentage of males with a disability within an area, or if Serbians simply ended up residing in those areas with higher or lower levels of percentage of males with a disability due to other factors.

Demographics Similar to Serbians by Male Disability

In terms of male disability, the demographic groups most similar to Serbians are Immigrants from Cambodia (11.5%, a difference of 0.0%), Ukrainian (11.5%, a difference of 0.010%), Jamaican (11.5%, a difference of 0.020%), Immigrants from Somalia (11.5%, a difference of 0.040%), and Icelander (11.6%, a difference of 0.080%).
DemographicsRating | RankMale Disability
Immigrants from Jamaica
16.3
/100
|
#198
Poor
11.5%
Lebanese
15.4
/100
|
#199
Poor
11.5%
Immigrants from Iraq
13.0
/100
|
#200
Poor
11.5%
Immigrants from Panama
13.0
/100
|
#201
Poor
11.5%
Immigrants from Mexico
12.6
/100
|
#202
Poor
11.5%
Jamaicans
10.9
/100
|
#203
Poor
11.5%
Immigrants from Cambodia
10.8
/100
|
#204
Poor
11.5%
Serbians
10.7
/100
|
#205
Poor
11.5%
Ukrainians
10.6
/100
|
#206
Poor
11.5%
Immigrants from Somalia
10.4
/100
|
#207
Poor
11.5%
Icelanders
10.1
/100
|
#208
Poor
11.6%
Spanish American Indians
10.1
/100
|
#209
Poor
11.6%
Ute
9.4
/100
|
#210
Tragic
11.6%
Immigrants from Thailand
8.4
/100
|
#211
Tragic
11.6%
Immigrants from Scotland
8.2
/100
|
#212
Tragic
11.6%

Serbian Male Disability Correlation Summary

MeasurementSerbian DataMale Disability Data
Minimum0.068%4.5%
Maximum48.1%48.7%
Range48.1%44.3%
Mean8.4%16.6%
Median5.7%14.3%
Interquartile 25% (IQ1)2.8%11.3%
Interquartile 75% (IQ3)10.3%21.0%
Interquartile Range (IQR)7.5%9.7%
Standard Deviation (Sample)9.3%8.8%
Standard Deviation (Population)9.2%8.8%

Correlation Details

Serbian PercentileSample SizeMale Disability
[
0.0%
-
0.5%
]
0.068%
232,553,98111.4%
[
0.0%
-
0.5%
]
0.32%
22,552,91011.2%
[
0.5%
-
1.0%
]
0.58%
5,976,96811.6%
[
0.5%
-
1.0%
]
0.83%
2,567,28011.8%
[
1.0%
-
1.5%
]
1.09%
1,546,68811.0%
[
1.0%
-
1.5%
]
1.32%
801,03211.5%
[
1.5%
-
2.0%
]
1.56%
336,90714.3%
[
1.5%
-
2.0%
]
1.83%
586,31810.6%
[
2.0%
-
2.5%
]
2.05%
263,04512.2%
[
2.0%
-
2.5%
]
2.30%
76,70813.2%
[
2.0%
-
2.5%
]
2.48%
97,77313.1%
[
2.5%
-
3.0%
]
2.78%
38,3619.5%
[
3.0%
-
3.5%
]
3.02%
22,10518.0%
[
3.0%
-
3.5%
]
3.21%
31,82817.9%
[
3.5%
-
4.0%
]
3.53%
40,7559.1%
[
3.5%
-
4.0%
]
3.80%
5,44111.4%
[
3.5%
-
4.0%
]
3.99%
48,59412.6%
[
4.0%
-
4.5%
]
4.21%
42,35916.2%
[
4.0%
-
4.5%
]
4.37%
4,86927.3%
[
4.5%
-
5.0%
]
4.76%
5,37311.4%
[
4.5%
-
5.0%
]
4.89%
1,8394.7%
[
5.0%
-
5.5%
]
5.13%
6,95510.0%
[
5.5%
-
6.0%
]
5.52%
3,74819.8%
[
5.5%
-
6.0%
]
5.74%
38326.2%
[
5.5%
-
6.0%
]
5.96%
4,37716.1%
[
6.0%
-
6.5%
]
6.34%
1,13611.3%
[
6.5%
-
7.0%
]
6.85%
6,22121.6%
[
7.0%
-
7.5%
]
7.04%
1,53415.8%
[
7.0%
-
7.5%
]
7.35%
6819.0%
[
7.5%
-
8.0%
]
7.68%
1,77125.2%
[
8.0%
-
8.5%
]
8.38%
33421.7%
[
8.5%
-
9.0%
]
8.58%
2,20321.0%
[
8.5%
-
9.0%
]
8.70%
2995.0%
[
8.5%
-
9.0%
]
9.00%
28911.9%
[
9.0%
-
9.5%
]
9.44%
1,8854.9%
[
10.0%
-
10.5%
]
10.33%
1,47228.2%
[
11.5%
-
12.0%
]
11.71%
1,68333.5%
[
12.0%
-
12.5%
]
12.24%
29419.0%
[
12.0%
-
12.5%
]
12.50%
1614.3%
[
13.0%
-
13.5%
]
13.33%
1,4484.5%
[
14.5%
-
15.0%
]
14.71%
1,03318.5%
[
16.0%
-
16.5%
]
16.48%
18248.7%
[
18.5%
-
19.0%
]
18.56%
29129.5%
[
20.5%
-
21.0%
]
20.51%
7827.6%
[
26.0%
-
26.5%
]
26.09%
6932.5%
[
37.0%
-
37.5%
]
37.02%
1,0324.6%
[
48.0%
-
48.5%
]
48.14%
29518.4%