Serbian Married-Couple Family Poverty

COMPARE

Serbian
Race
Ancestry
AfghanAfricanAlaska NativeAlaskan AthabascanAlbanianAleutAlsatianAmericanApacheArabArapahoArgentineanArmenianAssyrian/Chaldean/SyriacAustralianAustrianBahamianBangladeshiBarbadianBasqueBelgianBelizeanBermudanBhutaneseBlackfeetBolivianBrazilianBritishBritish West IndianBulgarianBurmeseCajunCambodianCanadianCape VerdeanCarpatho RusynCelticCentral AmericanCentral American IndianCherokeeCheyenneChickasawChileanChineseChippewaChoctawColombianColvilleComancheCosta RicanCreeCreekCroatianCrowCubanCypriotCzechCzechoslovakianDanishDelawareDominicanDutchDutch West IndianEastern EuropeanEcuadorianEgyptianEnglishEstonianEthiopianEuropeanFijianFilipinoFinnishFrenchFrench American IndianFrench CanadianGermanGerman RussianGhanaianGreekGuamanian/ChamorroGuatemalanGuyaneseHaitianHmongHonduranHopiHoumaHungarianIcelanderIndian (Asian)IndonesianInupiatIranianIraqiIrishIroquoisIsraeliItalianJamaicanJapaneseJordanianKenyanKiowaKoreanLaotianLatvianLebaneseLiberianLithuanianLumbeeLuxembourgerMacedonianMalaysianMalteseMarshalleseMenomineeMexicanMexican American IndianMongolianMoroccanNative HawaiianNavajoNepaleseNew ZealanderNicaraguanNigerianNorthern EuropeanNorwegianOkinawanOsageOttawaPaiutePakistaniPalestinianPanamanianParaguayanPennsylvania GermanPeruvianPimaPolishPortuguesePotawatomiPuebloPuerto RicanPuget Sound SalishRomanianRussianSalvadoranSamoanScandinavianScotch-IrishScottishSeminoleSenegaleseSerbianShoshoneSierra LeoneanSiouxSlavicSlovakSloveneSomaliSouth AfricanSouth AmericanSouth American IndianSoviet UnionSpaniardSpanishSpanish AmericanSpanish American IndianSri LankanSubsaharan AfricanSudaneseSwedishSwissSyrianTaiwaneseThaiTlingit-HaidaTohono O'OdhamTonganTrinidadian and TobagonianTsimshianTurkishU.S. Virgin IslanderUgandanUkrainianUruguayanUteVenezuelanVietnameseWelshWest IndianYakamaYaquiYugoslavianYumanYup'ikZimbabwean
Immigration
NonimmigrantsImmigrantsAfghanistanAfricaAlbaniaArgentinaArmeniaAsiaAustraliaAustriaBahamasBangladeshBarbadosBelarusBelgiumBelizeBoliviaBosnia and HerzegovinaBrazilBulgariaBurma/MyanmarCabo VerdeCambodiaCameroonCanadaCaribbeanCentral AmericaChileChinaColombiaCongoCosta RicaCroatiaCubaCzechoslovakiaDenmarkDominicaDominican RepublicEastern AfricaEastern AsiaEastern EuropeEcuadorEgyptEl SalvadorEnglandEritreaEthiopiaEuropeFijiFranceGermanyGhanaGreeceGrenadaGuatemalaGuyanaHaitiHondurasHong KongHungaryIndiaIndonesiaIranIraqIrelandIsraelItalyJamaicaJapanJordanKazakhstanKenyaKoreaKuwaitLaosLatin AmericaLatviaLebanonLiberiaLithuaniaMalaysiaMexicoMicronesiaMiddle AfricaMoldovaMoroccoNepalNetherlandsNicaraguaNigeriaNorth AmericaNorth MacedoniaNorthern AfricaNorthern EuropeNorwayOceaniaPakistanPanamaPeruPhilippinesPolandPortugalRomaniaRussiaSaudi ArabiaScotlandSenegalSerbiaSierra LeoneSingaporeSomaliaSouth AfricaSouth AmericaSouth Central AsiaSouth Eastern AsiaSouthern EuropeSpainSri LankaSt. Vincent and the GrenadinesSudanSwedenSwitzerlandSyriaTaiwanThailandTrinidad and TobagoTurkeyUgandaUkraineUruguayUzbekistanVenezuelaVietnamWest IndiesWestern AfricaWestern AsiaWestern EuropeYemenZaireZimbabweAzores
Select to Compare
Race
Ancestry
AfghanAfricanAlaska NativeAlaskan AthabascanAlbanianAleutAlsatianAmericanApacheArabArapahoArgentineanArmenianAssyrian/Chaldean/SyriacAustralianAustrianBahamianBangladeshiBarbadianBasqueBelgianBelizeanBermudanBhutaneseBlackfeetBolivianBrazilianBritishBritish West IndianBulgarianBurmeseCajunCambodianCanadianCape VerdeanCarpatho RusynCelticCentral AmericanCentral American IndianCherokeeCheyenneChickasawChileanChineseChippewaChoctawColombianColvilleComancheCosta RicanCreeCreekCroatianCrowCubanCypriotCzechCzechoslovakianDanishDelawareDominicanDutchDutch West IndianEastern EuropeanEcuadorianEgyptianEnglishEstonianEthiopianEuropeanFijianFilipinoFinnishFrenchFrench American IndianFrench CanadianGermanGerman RussianGhanaianGreekGuamanian/ChamorroGuatemalanGuyaneseHaitianHmongHonduranHopiHoumaHungarianIcelanderIndian (Asian)IndonesianInupiatIranianIraqiIrishIroquoisIsraeliItalianJamaicanJapaneseJordanianKenyanKiowaKoreanLaotianLatvianLebaneseLiberianLithuanianLumbeeLuxembourgerMacedonianMalaysianMalteseMarshalleseMenomineeMexicanMexican American IndianMongolianMoroccanNative HawaiianNavajoNepaleseNew ZealanderNicaraguanNigerianNorthern EuropeanNorwegianOkinawanOsageOttawaPaiutePakistaniPalestinianPanamanianParaguayanPennsylvania GermanPeruvianPimaPolishPortuguesePotawatomiPuebloPuerto RicanPuget Sound SalishRomanianRussianSalvadoranSamoanScandinavianScotch-IrishScottishSeminoleSenegaleseShoshoneSierra LeoneanSiouxSlavicSlovakSloveneSomaliSouth AfricanSouth AmericanSouth American IndianSoviet UnionSpaniardSpanishSpanish AmericanSpanish American IndianSri LankanSubsaharan AfricanSudaneseSwedishSwissSyrianTaiwaneseThaiTlingit-HaidaTohono O'OdhamTonganTrinidadian and TobagonianTsimshianTurkishU.S. Virgin IslanderUgandanUkrainianUruguayanUteVenezuelanVietnameseWelshWest IndianYakamaYaquiYugoslavianYumanYup'ikZimbabwean
Immigration
NonimmigrantsImmigrantsAfghanistanAfricaAlbaniaArgentinaArmeniaAsiaAustraliaAustriaBahamasBangladeshBarbadosBelarusBelgiumBelizeBoliviaBosnia and HerzegovinaBrazilBulgariaBurma/MyanmarCabo VerdeCambodiaCameroonCanadaCaribbeanCentral AmericaChileChinaColombiaCongoCosta RicaCroatiaCubaCzechoslovakiaDenmarkDominicaDominican RepublicEastern AfricaEastern AsiaEastern EuropeEcuadorEgyptEl SalvadorEnglandEritreaEthiopiaEuropeFijiFranceGermanyGhanaGreeceGrenadaGuatemalaGuyanaHaitiHondurasHong KongHungaryIndiaIndonesiaIranIraqIrelandIsraelItalyJamaicaJapanJordanKazakhstanKenyaKoreaKuwaitLaosLatin AmericaLatviaLebanonLiberiaLithuaniaMalaysiaMexicoMicronesiaMiddle AfricaMoldovaMoroccoNepalNetherlandsNicaraguaNigeriaNorth AmericaNorth MacedoniaNorthern AfricaNorthern EuropeNorwayOceaniaPakistanPanamaPeruPhilippinesPolandPortugalRomaniaRussiaSaudi ArabiaScotlandSenegalSerbiaSierra LeoneSingaporeSomaliaSouth AfricaSouth AmericaSouth Central AsiaSouth Eastern AsiaSouthern EuropeSpainSri LankaSt. Vincent and the GrenadinesSudanSwedenSwitzerlandSyriaTaiwanThailandTrinidad and TobagoTurkeyUgandaUkraineUruguayUzbekistanVenezuelaVietnamWest IndiesWestern AfricaWestern AsiaWestern EuropeYemenZaireZimbabweAzores
Married-Couple Family Poverty
Income
Poverty
Unemployment
Labor Participation
Family Structure
Vehicle Availability
Education Level
Disability

Serbian Married-Couple Family Poverty
Exceptional

4.3%
POVERTY | MARRIED-COUPLE FAMILIES
99.8/ 100
METRIC RATING
45th/ 347
METRIC RANK

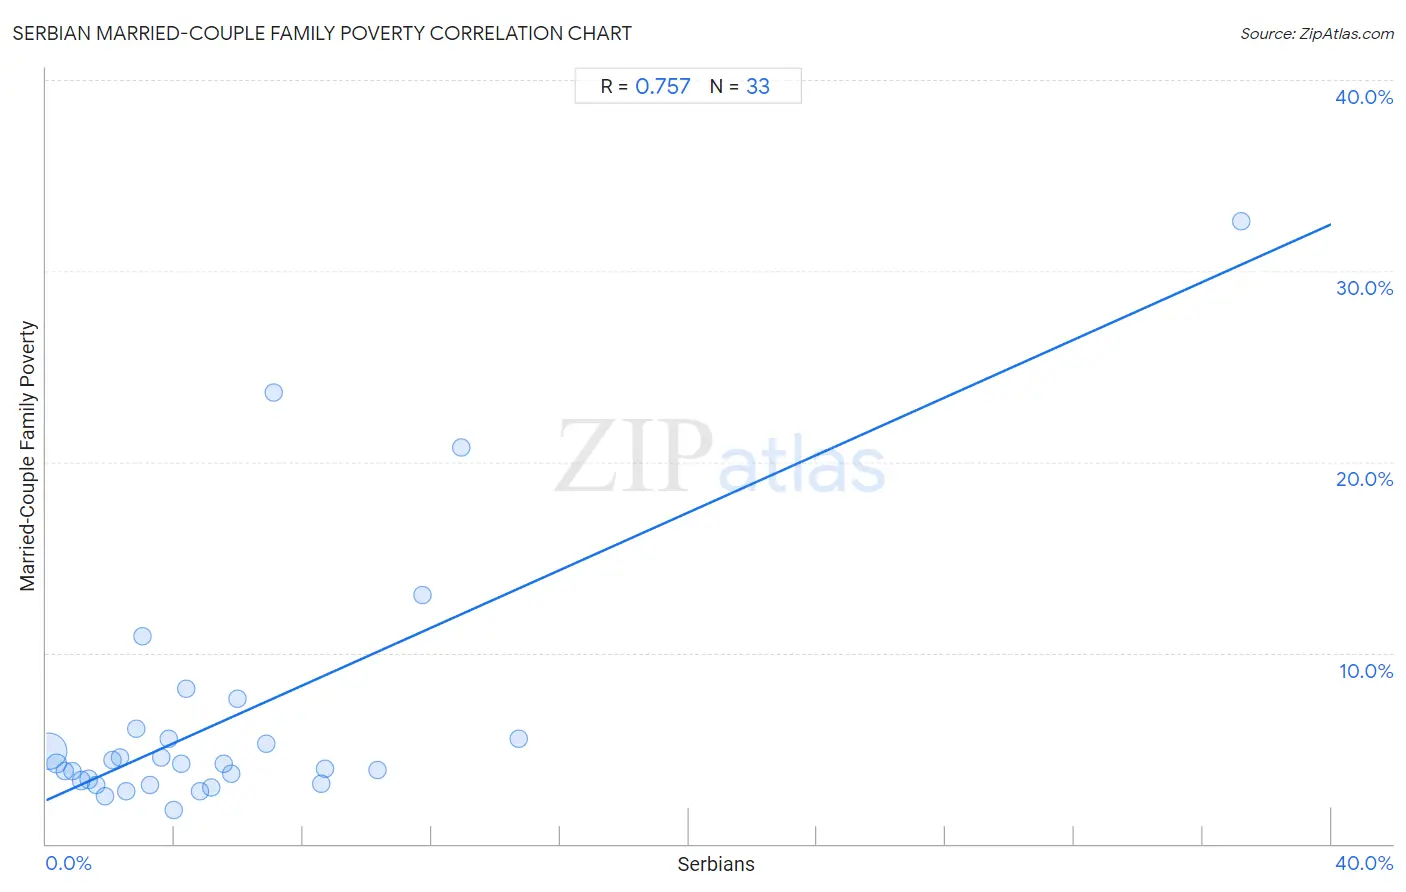
Serbian Married-Couple Family Poverty Correlation Chart

The statistical analysis conducted on geographies consisting of 265,760,862 people shows a strong positive correlation between the proportion of Serbians and poverty level among married-couple families in the United States with a correlation coefficient (R) of 0.757 and weighted average of 4.3%. On average, for every 1% (one percent) increase in Serbians within a typical geography, there is an increase of 0.75% in poverty level among married-couple families.
Serbian Married-Couple Family Poverty
It is essential to understand that the correlation between the percentage of Serbians and poverty level among married-couple families does not imply a direct cause-and-effect relationship. It remains uncertain whether the presence of Serbians influences an upward or downward trend in the level of poverty level among married-couple families within an area, or if Serbians simply ended up residing in those areas with higher or lower levels of poverty level among married-couple families due to other factors.

Demographics Similar to Serbians by Married-Couple Family Poverty

In terms of married-couple family poverty, the demographic groups most similar to Serbians are Immigrants from Japan (4.3%, a difference of 0.020%), British (4.3%, a difference of 0.030%), Immigrants from South Central Asia (4.3%, a difference of 0.14%), Australian (4.3%, a difference of 0.21%), and Turkish (4.3%, a difference of 0.29%).
DemographicsRating | RankMarried-Couple Family Poverty
Belgians
99.9
/100
|
#38
Exceptional
4.2%
Immigrants from Northern Europe
99.8
/100
|
#39
Exceptional
4.2%
French Canadians
99.8
/100
|
#40
Exceptional
4.2%
Northern Europeans
99.8
/100
|
#41
Exceptional
4.3%
Scottish
99.8
/100
|
#42
Exceptional
4.3%
Swiss
99.8
/100
|
#43
Exceptional
4.3%
Immigrants from Japan
99.8
/100
|
#44
Exceptional
4.3%
Serbians
99.8
/100
|
#45
Exceptional
4.3%
British
99.8
/100
|
#46
Exceptional
4.3%
Immigrants from South Central Asia
99.8
/100
|
#47
Exceptional
4.3%
Australians
99.7
/100
|
#48
Exceptional
4.3%
Turks
99.7
/100
|
#49
Exceptional
4.3%
Burmese
99.7
/100
|
#50
Exceptional
4.3%
Immigrants from Lithuania
99.7
/100
|
#51
Exceptional
4.3%
Russians
99.7
/100
|
#52
Exceptional
4.3%

Serbian Married-Couple Family Poverty Correlation Summary

MeasurementSerbian DataMarried-Couple Family Poverty Data
Minimum0.068%1.8%
Maximum37.2%32.6%
Range37.1%30.8%
Mean5.7%6.6%
Median4.0%4.2%
Interquartile 25% (IQ1)1.9%3.2%
Interquartile 75% (IQ3)7.0%5.8%
Interquartile Range (IQR)5.0%2.5%
Standard Deviation (Sample)6.8%6.7%
Standard Deviation (Population)6.7%6.6%

Correlation Details

Serbian PercentileSample SizeMarried-Couple Family Poverty
[
0.0%
-
0.5%
]
0.068%
231,648,3134.8%
[
0.0%
-
0.5%
]
0.32%
22,203,0534.2%
[
0.5%
-
1.0%
]
0.58%
5,766,9073.8%
[
0.5%
-
1.0%
]
0.83%
2,435,3973.8%
[
1.0%
-
1.5%
]
1.09%
1,477,6493.3%
[
1.0%
-
1.5%
]
1.32%
731,6203.4%
[
1.5%
-
2.0%
]
1.56%
302,6773.1%
[
1.5%
-
2.0%
]
1.83%
572,6542.5%
[
2.0%
-
2.5%
]
2.05%
225,8154.4%
[
2.0%
-
2.5%
]
2.30%
70,7714.5%
[
2.0%
-
2.5%
]
2.47%
95,5472.7%
[
2.5%
-
3.0%
]
2.80%
32,2516.1%
[
2.5%
-
3.0%
]
2.99%
13,38710.8%
[
3.0%
-
3.5%
]
3.21%
28,9063.0%
[
3.5%
-
4.0%
]
3.56%
30,4744.5%
[
3.5%
-
4.0%
]
3.81%
4,8335.5%
[
3.5%
-
4.0%
]
3.99%
46,3141.8%
[
4.0%
-
4.5%
]
4.21%
42,2664.2%
[
4.0%
-
4.5%
]
4.37%
4,7588.1%
[
4.5%
-
5.0%
]
4.77%
4,0222.8%
[
5.0%
-
5.5%
]
5.13%
6,7062.9%
[
5.5%
-
6.0%
]
5.52%
3,7484.2%
[
5.5%
-
6.0%
]
5.74%
3833.7%
[
5.5%
-
6.0%
]
5.97%
3,1687.6%
[
6.5%
-
7.0%
]
6.84%
1,5495.2%
[
7.0%
-
7.5%
]
7.09%
55023.6%
[
8.5%
-
9.0%
]
8.58%
2,2033.1%
[
8.5%
-
9.0%
]
8.70%
2993.9%
[
10.0%
-
10.5%
]
10.33%
1,4723.8%
[
11.5%
-
12.0%
]
11.71%
1,68313.0%
[
12.5%
-
13.0%
]
12.92%
32520.8%
[
14.5%
-
15.0%
]
14.71%
1,0335.5%
[
37.0%
-
37.5%
]
37.21%
12932.6%