Serbian Married-couple Households

COMPARE

Serbian
Race
Ancestry
AfghanAfricanAlaska NativeAlaskan AthabascanAlbanianAleutAlsatianAmericanApacheArabArapahoArgentineanArmenianAssyrian/Chaldean/SyriacAustralianAustrianBahamianBangladeshiBarbadianBasqueBelgianBelizeanBermudanBhutaneseBlackfeetBolivianBrazilianBritishBritish West IndianBulgarianBurmeseCajunCambodianCanadianCape VerdeanCarpatho RusynCelticCentral AmericanCentral American IndianCherokeeCheyenneChickasawChileanChineseChippewaChoctawColombianColvilleComancheCosta RicanCreeCreekCroatianCrowCubanCypriotCzechCzechoslovakianDanishDelawareDominicanDutchDutch West IndianEastern EuropeanEcuadorianEgyptianEnglishEstonianEthiopianEuropeanFijianFilipinoFinnishFrenchFrench American IndianFrench CanadianGermanGerman RussianGhanaianGreekGuamanian/ChamorroGuatemalanGuyaneseHaitianHmongHonduranHopiHoumaHungarianIcelanderIndian (Asian)IndonesianInupiatIranianIraqiIrishIroquoisIsraeliItalianJamaicanJapaneseJordanianKenyanKiowaKoreanLaotianLatvianLebaneseLiberianLithuanianLumbeeLuxembourgerMacedonianMalaysianMalteseMarshalleseMenomineeMexicanMexican American IndianMongolianMoroccanNative HawaiianNavajoNepaleseNew ZealanderNicaraguanNigerianNorthern EuropeanNorwegianOkinawanOsageOttawaPaiutePakistaniPalestinianPanamanianParaguayanPennsylvania GermanPeruvianPimaPolishPortuguesePotawatomiPuebloPuerto RicanPuget Sound SalishRomanianRussianSalvadoranSamoanScandinavianScotch-IrishScottishSeminoleSenegaleseSerbianShoshoneSierra LeoneanSiouxSlavicSlovakSloveneSomaliSouth AfricanSouth AmericanSouth American IndianSoviet UnionSpaniardSpanishSpanish AmericanSpanish American IndianSri LankanSubsaharan AfricanSudaneseSwedishSwissSyrianTaiwaneseThaiTlingit-HaidaTohono O'OdhamTonganTrinidadian and TobagonianTsimshianTurkishU.S. Virgin IslanderUgandanUkrainianUruguayanUteVenezuelanVietnameseWelshWest IndianYakamaYaquiYugoslavianYumanYup'ikZimbabwean
Immigration
NonimmigrantsImmigrantsAfghanistanAfricaAlbaniaArgentinaArmeniaAsiaAustraliaAustriaBahamasBangladeshBarbadosBelarusBelgiumBelizeBoliviaBosnia and HerzegovinaBrazilBulgariaBurma/MyanmarCabo VerdeCambodiaCameroonCanadaCaribbeanCentral AmericaChileChinaColombiaCongoCosta RicaCroatiaCubaCzechoslovakiaDenmarkDominicaDominican RepublicEastern AfricaEastern AsiaEastern EuropeEcuadorEgyptEl SalvadorEnglandEritreaEthiopiaEuropeFijiFranceGermanyGhanaGreeceGrenadaGuatemalaGuyanaHaitiHondurasHong KongHungaryIndiaIndonesiaIranIraqIrelandIsraelItalyJamaicaJapanJordanKazakhstanKenyaKoreaKuwaitLaosLatin AmericaLatviaLebanonLiberiaLithuaniaMalaysiaMexicoMicronesiaMiddle AfricaMoldovaMoroccoNepalNetherlandsNicaraguaNigeriaNorth AmericaNorth MacedoniaNorthern AfricaNorthern EuropeNorwayOceaniaPakistanPanamaPeruPhilippinesPolandPortugalRomaniaRussiaSaudi ArabiaScotlandSenegalSerbiaSierra LeoneSingaporeSomaliaSouth AfricaSouth AmericaSouth Central AsiaSouth Eastern AsiaSouthern EuropeSpainSri LankaSt. Vincent and the GrenadinesSudanSwedenSwitzerlandSyriaTaiwanThailandTrinidad and TobagoTurkeyUgandaUkraineUruguayUzbekistanVenezuelaVietnamWest IndiesWestern AfricaWestern AsiaWestern EuropeYemenZaireZimbabweAzores
Select to Compare
Race
Ancestry
AfghanAfricanAlaska NativeAlaskan AthabascanAlbanianAleutAlsatianAmericanApacheArabArapahoArgentineanArmenianAssyrian/Chaldean/SyriacAustralianAustrianBahamianBangladeshiBarbadianBasqueBelgianBelizeanBermudanBhutaneseBlackfeetBolivianBrazilianBritishBritish West IndianBulgarianBurmeseCajunCambodianCanadianCape VerdeanCarpatho RusynCelticCentral AmericanCentral American IndianCherokeeCheyenneChickasawChileanChineseChippewaChoctawColombianColvilleComancheCosta RicanCreeCreekCroatianCrowCubanCypriotCzechCzechoslovakianDanishDelawareDominicanDutchDutch West IndianEastern EuropeanEcuadorianEgyptianEnglishEstonianEthiopianEuropeanFijianFilipinoFinnishFrenchFrench American IndianFrench CanadianGermanGerman RussianGhanaianGreekGuamanian/ChamorroGuatemalanGuyaneseHaitianHmongHonduranHopiHoumaHungarianIcelanderIndian (Asian)IndonesianInupiatIranianIraqiIrishIroquoisIsraeliItalianJamaicanJapaneseJordanianKenyanKiowaKoreanLaotianLatvianLebaneseLiberianLithuanianLumbeeLuxembourgerMacedonianMalaysianMalteseMarshalleseMenomineeMexicanMexican American IndianMongolianMoroccanNative HawaiianNavajoNepaleseNew ZealanderNicaraguanNigerianNorthern EuropeanNorwegianOkinawanOsageOttawaPaiutePakistaniPalestinianPanamanianParaguayanPennsylvania GermanPeruvianPimaPolishPortuguesePotawatomiPuebloPuerto RicanPuget Sound SalishRomanianRussianSalvadoranSamoanScandinavianScotch-IrishScottishSeminoleSenegaleseShoshoneSierra LeoneanSiouxSlavicSlovakSloveneSomaliSouth AfricanSouth AmericanSouth American IndianSoviet UnionSpaniardSpanishSpanish AmericanSpanish American IndianSri LankanSubsaharan AfricanSudaneseSwedishSwissSyrianTaiwaneseThaiTlingit-HaidaTohono O'OdhamTonganTrinidadian and TobagonianTsimshianTurkishU.S. Virgin IslanderUgandanUkrainianUruguayanUteVenezuelanVietnameseWelshWest IndianYakamaYaquiYugoslavianYumanYup'ikZimbabwean
Immigration
NonimmigrantsImmigrantsAfghanistanAfricaAlbaniaArgentinaArmeniaAsiaAustraliaAustriaBahamasBangladeshBarbadosBelarusBelgiumBelizeBoliviaBosnia and HerzegovinaBrazilBulgariaBurma/MyanmarCabo VerdeCambodiaCameroonCanadaCaribbeanCentral AmericaChileChinaColombiaCongoCosta RicaCroatiaCubaCzechoslovakiaDenmarkDominicaDominican RepublicEastern AfricaEastern AsiaEastern EuropeEcuadorEgyptEl SalvadorEnglandEritreaEthiopiaEuropeFijiFranceGermanyGhanaGreeceGrenadaGuatemalaGuyanaHaitiHondurasHong KongHungaryIndiaIndonesiaIranIraqIrelandIsraelItalyJamaicaJapanJordanKazakhstanKenyaKoreaKuwaitLaosLatin AmericaLatviaLebanonLiberiaLithuaniaMalaysiaMexicoMicronesiaMiddle AfricaMoldovaMoroccoNepalNetherlandsNicaraguaNigeriaNorth AmericaNorth MacedoniaNorthern AfricaNorthern EuropeNorwayOceaniaPakistanPanamaPeruPhilippinesPolandPortugalRomaniaRussiaSaudi ArabiaScotlandSenegalSerbiaSierra LeoneSingaporeSomaliaSouth AfricaSouth AmericaSouth Central AsiaSouth Eastern AsiaSouthern EuropeSpainSri LankaSt. Vincent and the GrenadinesSudanSwedenSwitzerlandSyriaTaiwanThailandTrinidad and TobagoTurkeyUgandaUkraineUruguayUzbekistanVenezuelaVietnamWest IndiesWestern AfricaWestern AsiaWestern EuropeYemenZaireZimbabweAzores
Married-couple Households
Income
Poverty
Unemployment
Labor Participation
Family Structure
Vehicle Availability
Education Level
Disability

Serbian Married-couple Households
Good

47.0%
MARRIED-COUPLE HOUSEHOLDS
76.3/ 100
METRIC RATING
152nd/ 347
METRIC RANK

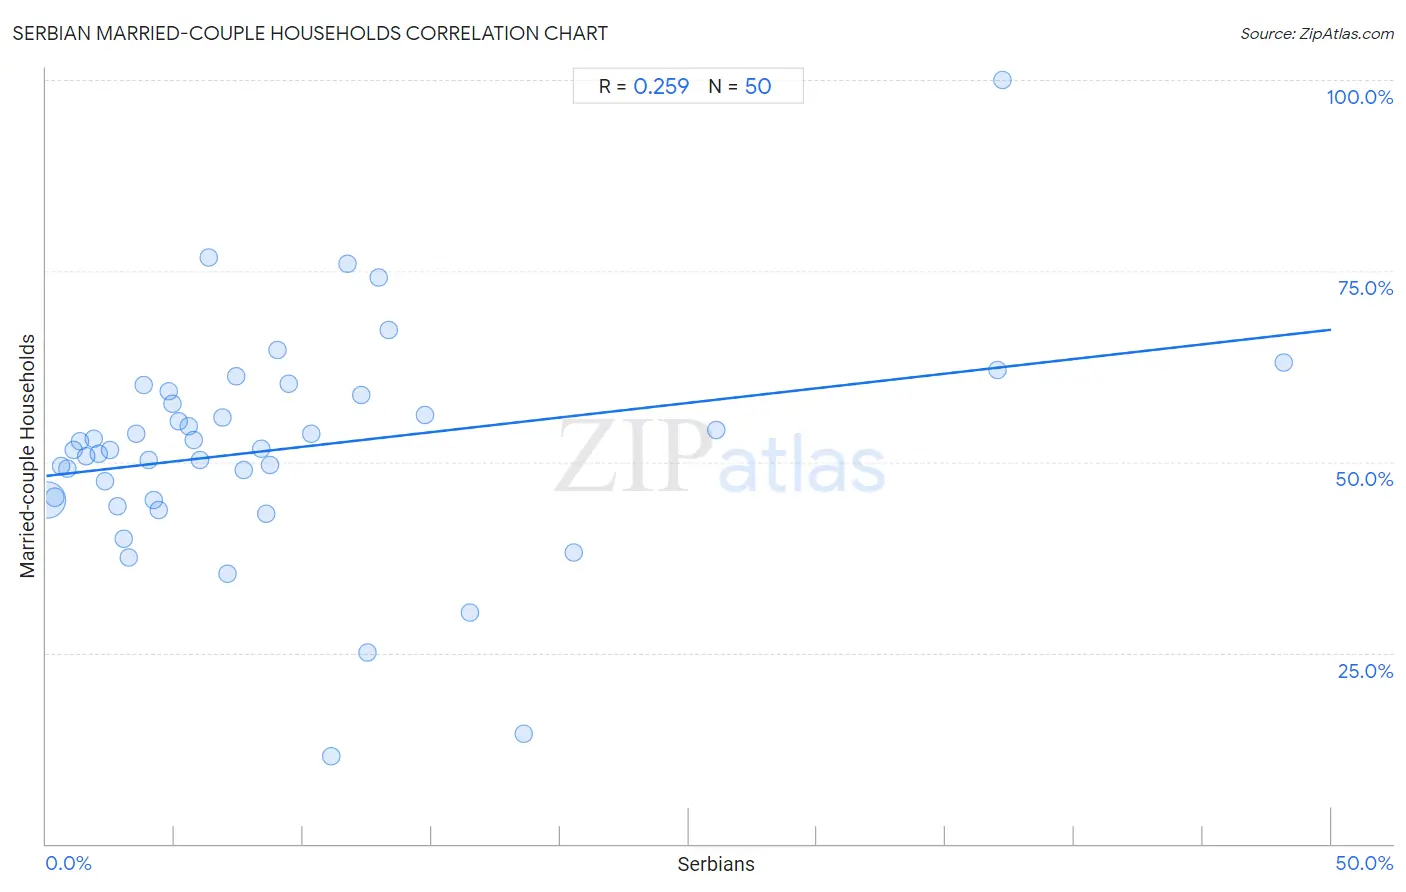
Serbian Married-couple Households Correlation Chart

The statistical analysis conducted on geographies consisting of 267,530,139 people shows a weak positive correlation between the proportion of Serbians and percentage of married-couple family households in the United States with a correlation coefficient (R) of 0.259 and weighted average of 47.0%. On average, for every 1% (one percent) increase in Serbians within a typical geography, there is an increase of 0.38% in percentage of married-couple family households.
Serbian Married-couple Households
It is essential to understand that the correlation between the percentage of Serbians and percentage of married-couple family households does not imply a direct cause-and-effect relationship. It remains uncertain whether the presence of Serbians influences an upward or downward trend in the level of percentage of married-couple family households within an area, or if Serbians simply ended up residing in those areas with higher or lower levels of percentage of married-couple family households due to other factors.

Demographics Similar to Serbians by Married-couple Households

In terms of married-couple households, the demographic groups most similar to Serbians are Hmong (47.0%, a difference of 0.010%), Immigrants from Western Asia (46.9%, a difference of 0.010%), Immigrants from Bulgaria (47.0%, a difference of 0.020%), Arab (46.9%, a difference of 0.020%), and Armenian (46.9%, a difference of 0.050%).
DemographicsRating | RankMarried-couple Households
Slovenes
81.7
/100
|
#145
Excellent
47.1%
Immigrants from Western Europe
81.6
/100
|
#146
Excellent
47.1%
Immigrants from Syria
81.6
/100
|
#147
Excellent
47.1%
Icelanders
79.5
/100
|
#148
Good
47.0%
Paraguayans
78.7
/100
|
#149
Good
47.0%
Immigrants from Russia
77.6
/100
|
#150
Good
47.0%
Immigrants from Bulgaria
76.8
/100
|
#151
Good
47.0%
Serbians
76.3
/100
|
#152
Good
47.0%
Hmong
76.2
/100
|
#153
Good
47.0%
Immigrants from Western Asia
76.1
/100
|
#154
Good
46.9%
Arabs
76.0
/100
|
#155
Good
46.9%
Armenians
75.4
/100
|
#156
Good
46.9%
Immigrants from Oceania
74.8
/100
|
#157
Good
46.9%
Nonimmigrants
73.3
/100
|
#158
Good
46.9%
Osage
73.2
/100
|
#159
Good
46.9%

Serbian Married-couple Households Correlation Summary

MeasurementSerbian DataMarried-couple Households Data
Minimum0.068%11.4%
Maximum48.1%100.0%
Range48.1%88.6%
Mean9.2%51.7%
Median6.2%51.7%
Interquartile 25% (IQ1)3.0%45.0%
Interquartile 75% (IQ3)11.7%58.7%
Interquartile Range (IQR)8.7%13.7%
Standard Deviation (Sample)9.9%14.6%
Standard Deviation (Population)9.8%14.5%

Correlation Details

Serbian PercentileSample SizeMarried-couple Households
[
0.0%
-
0.5%
]
0.068%
232,478,22145.0%
[
0.0%
-
0.5%
]
0.32%
22,523,79545.3%
[
0.5%
-
1.0%
]
0.58%
5,974,53249.5%
[
0.5%
-
1.0%
]
0.83%
2,567,28049.0%
[
1.0%
-
1.5%
]
1.09%
1,544,93051.5%
[
1.0%
-
1.5%
]
1.32%
800,62452.7%
[
1.5%
-
2.0%
]
1.56%
333,94950.8%
[
1.5%
-
2.0%
]
1.83%
586,70653.0%
[
2.0%
-
2.5%
]
2.05%
263,52751.1%
[
2.0%
-
2.5%
]
2.30%
76,70847.5%
[
2.0%
-
2.5%
]
2.48%
97,77351.6%
[
2.5%
-
3.0%
]
2.78%
38,36144.2%
[
3.0%
-
3.5%
]
3.02%
22,10540.0%
[
3.0%
-
3.5%
]
3.21%
31,82837.5%
[
3.5%
-
4.0%
]
3.53%
40,75553.7%
[
3.5%
-
4.0%
]
3.80%
5,44160.1%
[
3.5%
-
4.0%
]
3.99%
48,59450.3%
[
4.0%
-
4.5%
]
4.21%
42,45545.0%
[
4.0%
-
4.5%
]
4.37%
4,86943.7%
[
4.5%
-
5.0%
]
4.76%
5,37359.3%
[
4.5%
-
5.0%
]
4.89%
1,83957.7%
[
5.0%
-
5.5%
]
5.13%
6,95555.3%
[
5.5%
-
6.0%
]
5.52%
3,74854.7%
[
5.5%
-
6.0%
]
5.74%
38352.9%
[
5.5%
-
6.0%
]
5.96%
4,37750.3%
[
6.0%
-
6.5%
]
6.34%
1,13676.7%
[
6.5%
-
7.0%
]
6.85%
6,22155.8%
[
7.0%
-
7.5%
]
7.04%
1,53435.4%
[
7.0%
-
7.5%
]
7.39%
89361.2%
[
7.5%
-
8.0%
]
7.68%
1,77148.9%
[
8.0%
-
8.5%
]
8.38%
33451.7%
[
8.5%
-
9.0%
]
8.58%
2,20343.1%
[
8.5%
-
9.0%
]
8.70%
29949.5%
[
8.5%
-
9.0%
]
9.00%
28964.6%
[
9.0%
-
9.5%
]
9.44%
1,88560.2%
[
10.0%
-
10.5%
]
10.33%
1,47253.6%
[
11.0%
-
11.5%
]
11.11%
9911.4%
[
11.5%
-
12.0%
]
11.71%
1,68376.0%
[
12.0%
-
12.5%
]
12.24%
29458.7%
[
12.0%
-
12.5%
]
12.50%
1625.0%
[
12.5%
-
13.0%
]
12.92%
32574.1%
[
13.0%
-
13.5%
]
13.33%
1,44867.3%
[
14.5%
-
15.0%
]
14.71%
1,03356.2%
[
16.0%
-
16.5%
]
16.48%
18230.3%
[
18.5%
-
19.0%
]
18.56%
29114.5%
[
20.5%
-
21.0%
]
20.51%
7838.1%
[
26.0%
-
26.5%
]
26.09%
6954.2%
[
37.0%
-
37.5%
]
37.02%
1,03262.0%
[
37.0%
-
37.5%
]
37.21%
129100.0%
[
48.0%
-
48.5%
]
48.14%
29563.0%