Serbian GED/Equivalency

COMPARE

Serbian
Race
Ancestry
AfghanAfricanAlaska NativeAlaskan AthabascanAlbanianAleutAlsatianAmericanApacheArabArapahoArgentineanArmenianAssyrian/Chaldean/SyriacAustralianAustrianBahamianBangladeshiBarbadianBasqueBelgianBelizeanBermudanBhutaneseBlackfeetBolivianBrazilianBritishBritish West IndianBulgarianBurmeseCajunCambodianCanadianCape VerdeanCarpatho RusynCelticCentral AmericanCentral American IndianCherokeeCheyenneChickasawChileanChineseChippewaChoctawColombianColvilleComancheCosta RicanCreeCreekCroatianCrowCubanCypriotCzechCzechoslovakianDanishDelawareDominicanDutchDutch West IndianEastern EuropeanEcuadorianEgyptianEnglishEstonianEthiopianEuropeanFijianFilipinoFinnishFrenchFrench American IndianFrench CanadianGermanGerman RussianGhanaianGreekGuamanian/ChamorroGuatemalanGuyaneseHaitianHmongHonduranHopiHoumaHungarianIcelanderIndian (Asian)IndonesianInupiatIranianIraqiIrishIroquoisIsraeliItalianJamaicanJapaneseJordanianKenyanKiowaKoreanLaotianLatvianLebaneseLiberianLithuanianLumbeeLuxembourgerMacedonianMalaysianMalteseMarshalleseMenomineeMexicanMexican American IndianMongolianMoroccanNative HawaiianNavajoNepaleseNew ZealanderNicaraguanNigerianNorthern EuropeanNorwegianOkinawanOsageOttawaPaiutePakistaniPalestinianPanamanianParaguayanPennsylvania GermanPeruvianPimaPolishPortuguesePotawatomiPuebloPuerto RicanPuget Sound SalishRomanianRussianSalvadoranSamoanScandinavianScotch-IrishScottishSeminoleSenegaleseSerbianShoshoneSierra LeoneanSiouxSlavicSlovakSloveneSomaliSouth AfricanSouth AmericanSouth American IndianSoviet UnionSpaniardSpanishSpanish AmericanSpanish American IndianSri LankanSubsaharan AfricanSudaneseSwedishSwissSyrianTaiwaneseThaiTlingit-HaidaTohono O'OdhamTonganTrinidadian and TobagonianTsimshianTurkishU.S. Virgin IslanderUgandanUkrainianUruguayanUteVenezuelanVietnameseWelshWest IndianYakamaYaquiYugoslavianYumanYup'ikZimbabwean
Immigration
NonimmigrantsImmigrantsAfghanistanAfricaAlbaniaArgentinaArmeniaAsiaAustraliaAustriaBahamasBangladeshBarbadosBelarusBelgiumBelizeBoliviaBosnia and HerzegovinaBrazilBulgariaBurma/MyanmarCabo VerdeCambodiaCameroonCanadaCaribbeanCentral AmericaChileChinaColombiaCongoCosta RicaCroatiaCubaCzechoslovakiaDenmarkDominicaDominican RepublicEastern AfricaEastern AsiaEastern EuropeEcuadorEgyptEl SalvadorEnglandEritreaEthiopiaEuropeFijiFranceGermanyGhanaGreeceGrenadaGuatemalaGuyanaHaitiHondurasHong KongHungaryIndiaIndonesiaIranIraqIrelandIsraelItalyJamaicaJapanJordanKazakhstanKenyaKoreaKuwaitLaosLatin AmericaLatviaLebanonLiberiaLithuaniaMalaysiaMexicoMicronesiaMiddle AfricaMoldovaMoroccoNepalNetherlandsNicaraguaNigeriaNorth AmericaNorth MacedoniaNorthern AfricaNorthern EuropeNorwayOceaniaPakistanPanamaPeruPhilippinesPolandPortugalRomaniaRussiaSaudi ArabiaScotlandSenegalSerbiaSierra LeoneSingaporeSomaliaSouth AfricaSouth AmericaSouth Central AsiaSouth Eastern AsiaSouthern EuropeSpainSri LankaSt. Vincent and the GrenadinesSudanSwedenSwitzerlandSyriaTaiwanThailandTrinidad and TobagoTurkeyUgandaUkraineUruguayUzbekistanVenezuelaVietnamWest IndiesWestern AfricaWestern AsiaWestern EuropeYemenZaireZimbabweAzores
Select to Compare
Race
Ancestry
AfghanAfricanAlaska NativeAlaskan AthabascanAlbanianAleutAlsatianAmericanApacheArabArapahoArgentineanArmenianAssyrian/Chaldean/SyriacAustralianAustrianBahamianBangladeshiBarbadianBasqueBelgianBelizeanBermudanBhutaneseBlackfeetBolivianBrazilianBritishBritish West IndianBulgarianBurmeseCajunCambodianCanadianCape VerdeanCarpatho RusynCelticCentral AmericanCentral American IndianCherokeeCheyenneChickasawChileanChineseChippewaChoctawColombianColvilleComancheCosta RicanCreeCreekCroatianCrowCubanCypriotCzechCzechoslovakianDanishDelawareDominicanDutchDutch West IndianEastern EuropeanEcuadorianEgyptianEnglishEstonianEthiopianEuropeanFijianFilipinoFinnishFrenchFrench American IndianFrench CanadianGermanGerman RussianGhanaianGreekGuamanian/ChamorroGuatemalanGuyaneseHaitianHmongHonduranHopiHoumaHungarianIcelanderIndian (Asian)IndonesianInupiatIranianIraqiIrishIroquoisIsraeliItalianJamaicanJapaneseJordanianKenyanKiowaKoreanLaotianLatvianLebaneseLiberianLithuanianLumbeeLuxembourgerMacedonianMalaysianMalteseMarshalleseMenomineeMexicanMexican American IndianMongolianMoroccanNative HawaiianNavajoNepaleseNew ZealanderNicaraguanNigerianNorthern EuropeanNorwegianOkinawanOsageOttawaPaiutePakistaniPalestinianPanamanianParaguayanPennsylvania GermanPeruvianPimaPolishPortuguesePotawatomiPuebloPuerto RicanPuget Sound SalishRomanianRussianSalvadoranSamoanScandinavianScotch-IrishScottishSeminoleSenegaleseShoshoneSierra LeoneanSiouxSlavicSlovakSloveneSomaliSouth AfricanSouth AmericanSouth American IndianSoviet UnionSpaniardSpanishSpanish AmericanSpanish American IndianSri LankanSubsaharan AfricanSudaneseSwedishSwissSyrianTaiwaneseThaiTlingit-HaidaTohono O'OdhamTonganTrinidadian and TobagonianTsimshianTurkishU.S. Virgin IslanderUgandanUkrainianUruguayanUteVenezuelanVietnameseWelshWest IndianYakamaYaquiYugoslavianYumanYup'ikZimbabwean
Immigration
NonimmigrantsImmigrantsAfghanistanAfricaAlbaniaArgentinaArmeniaAsiaAustraliaAustriaBahamasBangladeshBarbadosBelarusBelgiumBelizeBoliviaBosnia and HerzegovinaBrazilBulgariaBurma/MyanmarCabo VerdeCambodiaCameroonCanadaCaribbeanCentral AmericaChileChinaColombiaCongoCosta RicaCroatiaCubaCzechoslovakiaDenmarkDominicaDominican RepublicEastern AfricaEastern AsiaEastern EuropeEcuadorEgyptEl SalvadorEnglandEritreaEthiopiaEuropeFijiFranceGermanyGhanaGreeceGrenadaGuatemalaGuyanaHaitiHondurasHong KongHungaryIndiaIndonesiaIranIraqIrelandIsraelItalyJamaicaJapanJordanKazakhstanKenyaKoreaKuwaitLaosLatin AmericaLatviaLebanonLiberiaLithuaniaMalaysiaMexicoMicronesiaMiddle AfricaMoldovaMoroccoNepalNetherlandsNicaraguaNigeriaNorth AmericaNorth MacedoniaNorthern AfricaNorthern EuropeNorwayOceaniaPakistanPanamaPeruPhilippinesPolandPortugalRomaniaRussiaSaudi ArabiaScotlandSenegalSerbiaSierra LeoneSingaporeSomaliaSouth AfricaSouth AmericaSouth Central AsiaSouth Eastern AsiaSouthern EuropeSpainSri LankaSt. Vincent and the GrenadinesSudanSwedenSwitzerlandSyriaTaiwanThailandTrinidad and TobagoTurkeyUgandaUkraineUruguayUzbekistanVenezuelaVietnamWest IndiesWestern AfricaWestern AsiaWestern EuropeYemenZaireZimbabweAzores
GED/Equivalency
Income
Poverty
Unemployment
Labor Participation
Family Structure
Vehicle Availability
Education Level
Disability

Serbian GED/Equivalency
Exceptional

87.9%
GED/EQUIVALENCY
99.3/ 100
METRIC RATING
59th/ 347
METRIC RANK

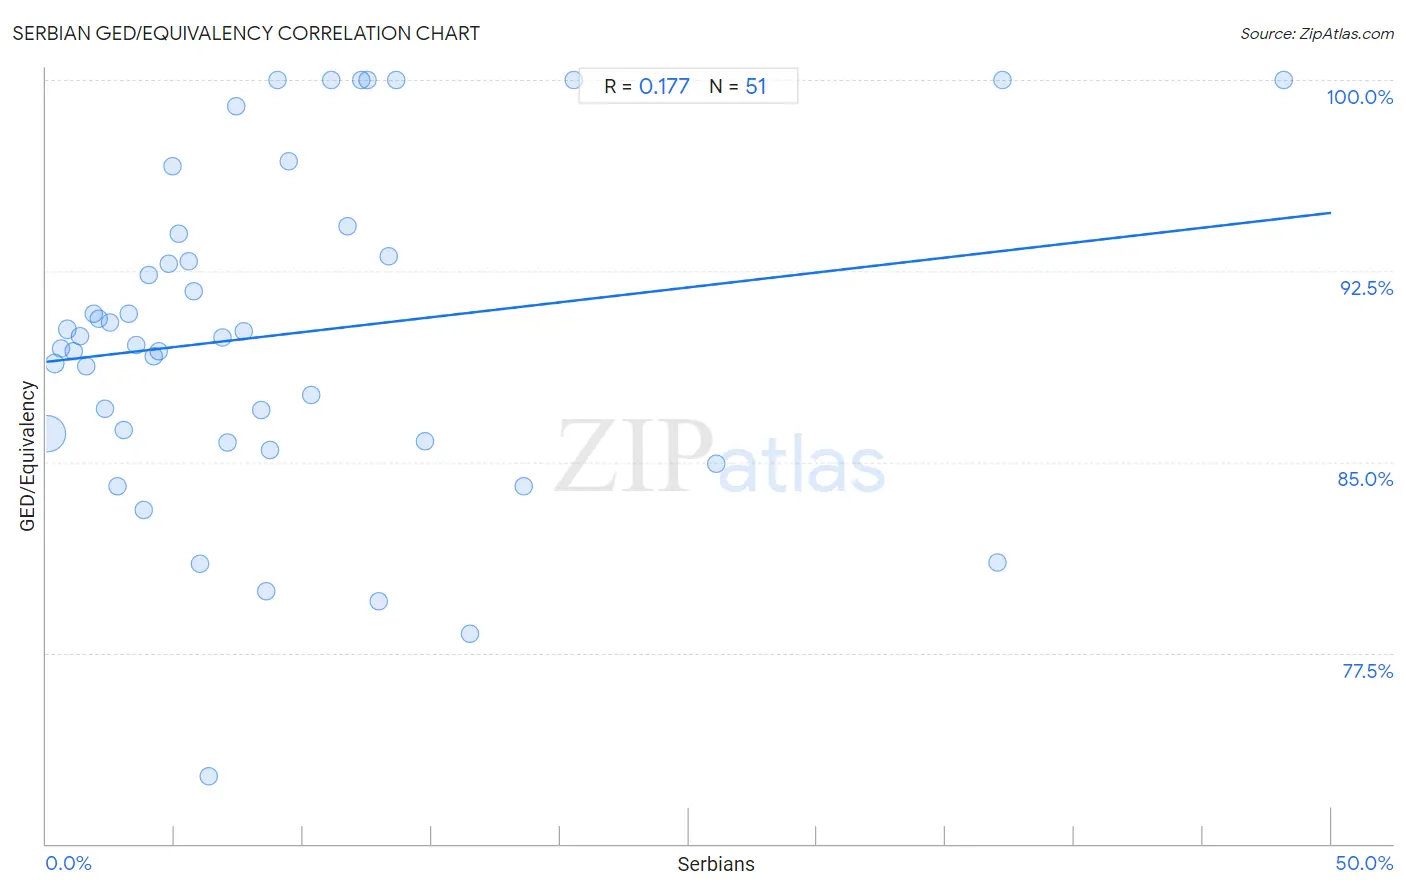
Serbian GED/Equivalency Correlation Chart

The statistical analysis conducted on geographies consisting of 267,642,942 people shows a poor positive correlation between the proportion of Serbians and percentage of population with at least ged/equivalency education in the United States with a correlation coefficient (R) of 0.177 and weighted average of 87.9%. On average, for every 1% (one percent) increase in Serbians within a typical geography, there is an increase of 0.12% in percentage of population with at least ged/equivalency education.
Serbian GED/Equivalency
It is essential to understand that the correlation between the percentage of Serbians and percentage of population with at least ged/equivalency education does not imply a direct cause-and-effect relationship. It remains uncertain whether the presence of Serbians influences an upward or downward trend in the level of percentage of population with at least ged/equivalency education within an area, or if Serbians simply ended up residing in those areas with higher or lower levels of percentage of population with at least ged/equivalency education due to other factors.

Demographics Similar to Serbians by GED/Equivalency

In terms of ged/equivalency, the demographic groups most similar to Serbians are Immigrants from Czechoslovakia (87.9%, a difference of 0.010%), Northern European (87.9%, a difference of 0.010%), Scandinavian (87.9%, a difference of 0.010%), European (87.9%, a difference of 0.010%), and German (87.9%, a difference of 0.030%).
DemographicsRating | RankGED/Equivalency
Zimbabweans
99.4
/100
|
#52
Exceptional
88.0%
Immigrants from South Africa
99.4
/100
|
#53
Exceptional
88.0%
Soviet Union
99.4
/100
|
#54
Exceptional
88.0%
New Zealanders
99.4
/100
|
#55
Exceptional
88.0%
Immigrants from Denmark
99.4
/100
|
#56
Exceptional
88.0%
Immigrants from Czechoslovakia
99.3
/100
|
#57
Exceptional
87.9%
Northern Europeans
99.3
/100
|
#58
Exceptional
87.9%
Serbians
99.3
/100
|
#59
Exceptional
87.9%
Scandinavians
99.3
/100
|
#60
Exceptional
87.9%
Europeans
99.3
/100
|
#61
Exceptional
87.9%
Germans
99.3
/100
|
#62
Exceptional
87.9%
Immigrants from Turkey
99.2
/100
|
#63
Exceptional
87.9%
Immigrants from Canada
99.2
/100
|
#64
Exceptional
87.9%
Immigrants from North America
99.1
/100
|
#65
Exceptional
87.8%
Immigrants from Bulgaria
99.1
/100
|
#66
Exceptional
87.8%

Serbian GED/Equivalency Correlation Summary

MeasurementSerbian DataGED/Equivalency Data
Minimum0.068%72.6%
Maximum48.1%100.0%
Range48.1%27.4%
Mean9.2%90.0%
Median6.3%89.9%
Interquartile 25% (IQ1)3.0%85.8%
Interquartile 75% (IQ3)12.2%94.0%
Interquartile Range (IQR)9.2%8.2%
Standard Deviation (Sample)9.8%6.5%
Standard Deviation (Population)9.7%6.4%

Correlation Details

Serbian PercentileSample SizeGED/Equivalency
[
0.0%
-
0.5%
]
0.068%
232,563,13386.1%
[
0.0%
-
0.5%
]
0.32%
22,544,88288.9%
[
0.5%
-
1.0%
]
0.58%
5,975,84489.5%
[
0.5%
-
1.0%
]
0.83%
2,567,28090.2%
[
1.0%
-
1.5%
]
1.09%
1,546,68889.4%
[
1.0%
-
1.5%
]
1.32%
801,10389.9%
[
1.5%
-
2.0%
]
1.56%
336,90788.8%
[
1.5%
-
2.0%
]
1.83%
586,70690.8%
[
2.0%
-
2.5%
]
2.05%
263,52790.6%
[
2.0%
-
2.5%
]
2.30%
76,70887.1%
[
2.0%
-
2.5%
]
2.48%
97,77390.5%
[
2.5%
-
3.0%
]
2.78%
38,36184.0%
[
3.0%
-
3.5%
]
3.02%
22,10586.2%
[
3.0%
-
3.5%
]
3.21%
31,82890.8%
[
3.5%
-
4.0%
]
3.53%
41,00889.6%
[
3.5%
-
4.0%
]
3.80%
5,44183.1%
[
3.5%
-
4.0%
]
3.99%
48,59492.3%
[
4.0%
-
4.5%
]
4.21%
42,45589.2%
[
4.0%
-
4.5%
]
4.37%
4,86989.3%
[
4.5%
-
5.0%
]
4.76%
5,37392.8%
[
4.5%
-
5.0%
]
4.89%
1,83996.6%
[
5.0%
-
5.5%
]
5.13%
6,95594.0%
[
5.5%
-
6.0%
]
5.52%
3,74892.9%
[
5.5%
-
6.0%
]
5.74%
38391.7%
[
5.5%
-
6.0%
]
5.96%
4,37781.0%
[
6.0%
-
6.5%
]
6.34%
1,13672.6%
[
6.5%
-
7.0%
]
6.85%
6,22189.9%
[
7.0%
-
7.5%
]
7.04%
1,53485.8%
[
7.0%
-
7.5%
]
7.39%
89399.0%
[
7.5%
-
8.0%
]
7.68%
1,77190.1%
[
8.0%
-
8.5%
]
8.38%
33487.0%
[
8.5%
-
9.0%
]
8.58%
2,20379.9%
[
8.5%
-
9.0%
]
8.70%
29985.5%
[
8.5%
-
9.0%
]
9.00%
289100.0%
[
9.0%
-
9.5%
]
9.44%
1,88596.8%
[
10.0%
-
10.5%
]
10.33%
1,47287.6%
[
11.0%
-
11.5%
]
11.11%
99100.0%
[
11.5%
-
12.0%
]
11.71%
1,68394.2%
[
12.0%
-
12.5%
]
12.24%
294100.0%
[
12.0%
-
12.5%
]
12.50%
16100.0%
[
12.5%
-
13.0%
]
12.92%
32579.5%
[
13.0%
-
13.5%
]
13.33%
1,44893.1%
[
13.5%
-
14.0%
]
13.64%
44100.0%
[
14.5%
-
15.0%
]
14.71%
1,03385.8%
[
16.0%
-
16.5%
]
16.48%
18278.3%
[
18.5%
-
19.0%
]
18.56%
29184.0%
[
20.5%
-
21.0%
]
20.51%
78100.0%
[
26.0%
-
26.5%
]
26.09%
6984.9%
[
37.0%
-
37.5%
]
37.02%
1,03281.1%
[
37.0%
-
37.5%
]
37.21%
129100.0%
[
48.0%
-
48.5%
]
48.14%
295100.0%