Serbian 2 or more Vehicles in Household
COMPARE
Serbian
Select to Compare
2 or more Vehicles in Household
Serbian 2 or more Vehicles in Household
56.1%
2+ VEHICLES AVAILABLE
80.3/ 100
METRIC RATING
147th/ 347
METRIC RANK
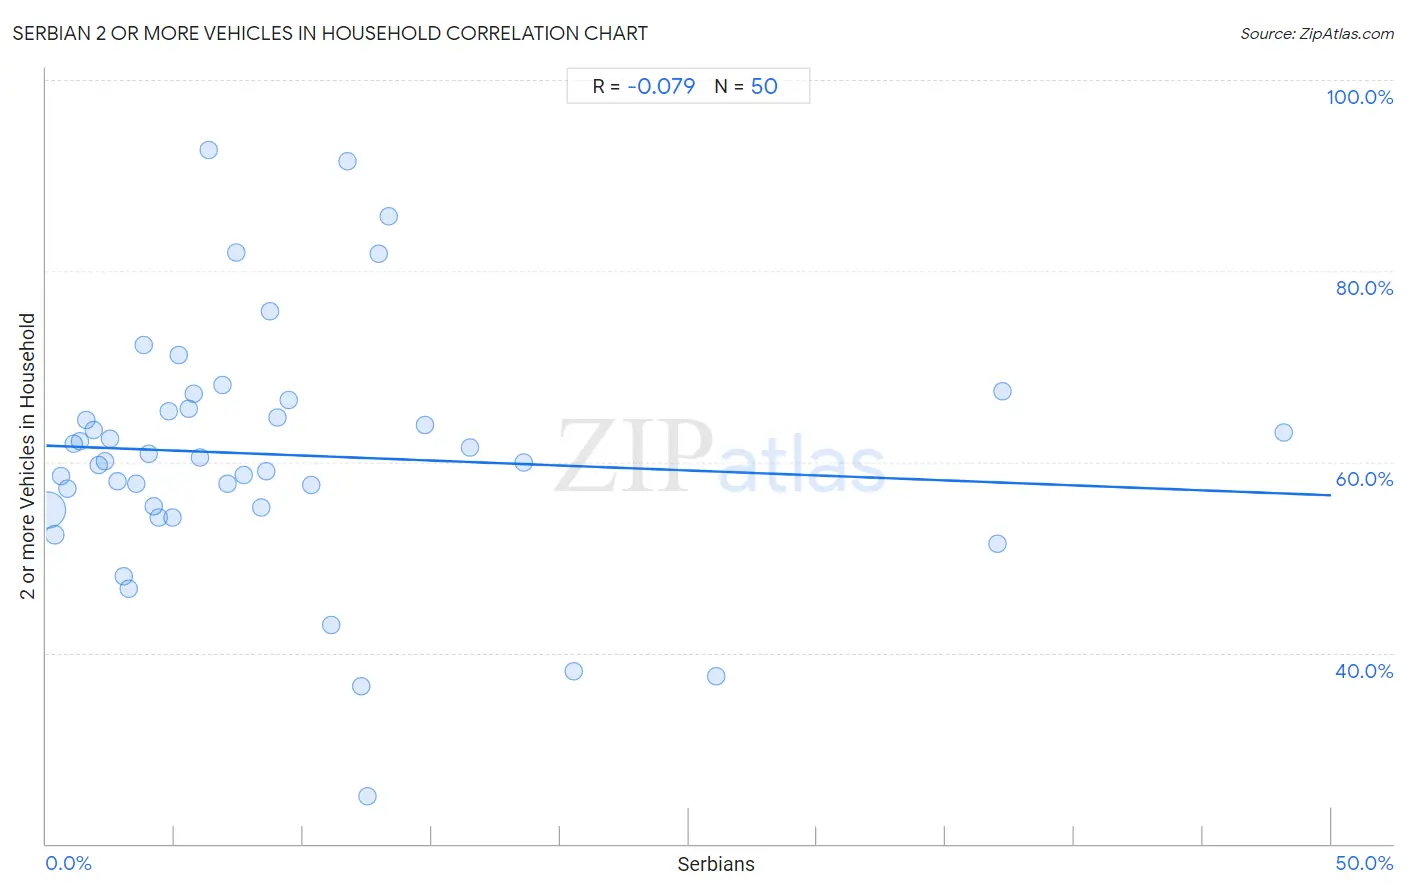
Serbian 2 or more Vehicles in Household Correlation Chart
The statistical analysis conducted on geographies consisting of 267,548,486 people shows a slight negative correlation between the proportion of Serbians and percentage of households with 2 or more vehicles available in the United States with a correlation coefficient (R) of -0.079 and weighted average of 56.1%. On average, for every 1% (one percent) increase in Serbians within a typical geography, there is a decrease of 0.10% in percentage of households with 2 or more vehicles available.
It is essential to understand that the correlation between the percentage of Serbians and percentage of households with 2 or more vehicles available does not imply a direct cause-and-effect relationship. It remains uncertain whether the presence of Serbians influences an upward or downward trend in the level of percentage of households with 2 or more vehicles available within an area, or if Serbians simply ended up residing in those areas with higher or lower levels of percentage of households with 2 or more vehicles available due to other factors.
Demographics Similar to Serbians by 2 or more Vehicles in Household
In terms of 2 or more vehicles in household, the demographic groups most similar to Serbians are Immigrants from Moldova (56.1%, a difference of 0.0%), Chilean (56.1%, a difference of 0.010%), Venezuelan (56.1%, a difference of 0.020%), Nicaraguan (56.1%, a difference of 0.030%), and Syrian (56.2%, a difference of 0.060%).
| Demographics | Rating | Rank | 2 or more Vehicles in Household |
| Latvians | 83.6 /100 | #140 | Excellent 56.2% |
| Immigrants from Cambodia | 83.6 /100 | #141 | Excellent 56.2% |
| South Africans | 83.1 /100 | #142 | Excellent 56.2% |
| Seminole | 81.7 /100 | #143 | Excellent 56.2% |
| Immigrants from Syria | 81.4 /100 | #144 | Excellent 56.2% |
| Syrians | 81.2 /100 | #145 | Excellent 56.2% |
| Venezuelans | 80.7 /100 | #146 | Excellent 56.1% |
| Serbians | 80.3 /100 | #147 | Excellent 56.1% |
| Immigrants from Moldova | 80.2 /100 | #148 | Excellent 56.1% |
| Chileans | 80.2 /100 | #149 | Excellent 56.1% |
| Nicaraguans | 79.9 /100 | #150 | Good 56.1% |
| Immigrants from Northern Europe | 78.7 /100 | #151 | Good 56.1% |
| Immigrants from Pakistan | 78.1 /100 | #152 | Good 56.1% |
| Lumbee | 71.9 /100 | #153 | Good 55.9% |
| Ukrainians | 70.8 /100 | #154 | Good 55.8% |
Serbian 2 or more Vehicles in Household Correlation Summary
| Measurement | Serbian Data | 2 or more Vehicles in Household Data |
| Minimum | 0.068% | 25.0% |
| Maximum | 48.1% | 92.6% |
| Range | 48.1% | 67.6% |
| Mean | 9.2% | 60.8% |
| Median | 6.2% | 60.2% |
| Interquartile 25% (IQ1) | 3.0% | 55.2% |
| Interquartile 75% (IQ3) | 11.7% | 65.6% |
| Interquartile Range (IQR) | 8.7% | 10.4% |
| Standard Deviation (Sample) | 9.9% | 12.9% |
| Standard Deviation (Population) | 9.8% | 12.8% |
Correlation Details
| Serbian Percentile | Sample Size | 2 or more Vehicles in Household |
[ 0.0% - 0.5% ] 0.068% | 232,489,595 | 54.9% |
[ 0.0% - 0.5% ] 0.32% | 22,530,768 | 52.4% |
[ 0.5% - 1.0% ] 0.58% | 5,974,532 | 58.5% |
[ 0.5% - 1.0% ] 0.83% | 2,567,280 | 57.2% |
[ 1.0% - 1.5% ] 1.09% | 1,544,930 | 61.9% |
[ 1.0% - 1.5% ] 1.32% | 800,624 | 62.2% |
[ 1.5% - 2.0% ] 1.56% | 333,949 | 64.3% |
[ 1.5% - 2.0% ] 1.83% | 586,706 | 63.3% |
[ 2.0% - 2.5% ] 2.05% | 263,527 | 59.7% |
[ 2.0% - 2.5% ] 2.30% | 76,708 | 60.0% |
[ 2.0% - 2.5% ] 2.48% | 97,773 | 62.4% |
[ 2.5% - 3.0% ] 2.78% | 38,361 | 58.0% |
[ 3.0% - 3.5% ] 3.02% | 22,105 | 48.0% |
[ 3.0% - 3.5% ] 3.21% | 31,828 | 46.7% |
[ 3.5% - 4.0% ] 3.53% | 40,755 | 57.8% |
[ 3.5% - 4.0% ] 3.80% | 5,441 | 72.3% |
[ 3.5% - 4.0% ] 3.99% | 48,594 | 60.9% |
[ 4.0% - 4.5% ] 4.21% | 42,455 | 55.4% |
[ 4.0% - 4.5% ] 4.37% | 4,869 | 54.1% |
[ 4.5% - 5.0% ] 4.76% | 5,373 | 65.3% |
[ 4.5% - 5.0% ] 4.89% | 1,839 | 54.2% |
[ 5.0% - 5.5% ] 5.13% | 6,955 | 71.2% |
[ 5.5% - 6.0% ] 5.52% | 3,748 | 65.6% |
[ 5.5% - 6.0% ] 5.74% | 383 | 67.1% |
[ 5.5% - 6.0% ] 5.96% | 4,377 | 60.4% |
[ 6.0% - 6.5% ] 6.34% | 1,136 | 92.6% |
[ 6.5% - 7.0% ] 6.85% | 6,221 | 68.1% |
[ 7.0% - 7.5% ] 7.04% | 1,534 | 57.7% |
[ 7.0% - 7.5% ] 7.39% | 893 | 81.9% |
[ 7.5% - 8.0% ] 7.68% | 1,771 | 58.7% |
[ 8.0% - 8.5% ] 8.38% | 334 | 55.2% |
[ 8.5% - 9.0% ] 8.58% | 2,203 | 59.0% |
[ 8.5% - 9.0% ] 8.70% | 299 | 75.7% |
[ 8.5% - 9.0% ] 9.00% | 289 | 64.6% |
[ 9.0% - 9.5% ] 9.44% | 1,885 | 66.5% |
[ 10.0% - 10.5% ] 10.33% | 1,472 | 57.5% |
[ 11.0% - 11.5% ] 11.11% | 99 | 42.9% |
[ 11.5% - 12.0% ] 11.71% | 1,683 | 91.5% |
[ 12.0% - 12.5% ] 12.24% | 294 | 36.5% |
[ 12.0% - 12.5% ] 12.50% | 16 | 25.0% |
[ 12.5% - 13.0% ] 12.92% | 325 | 81.8% |
[ 13.0% - 13.5% ] 13.33% | 1,448 | 85.7% |
[ 14.5% - 15.0% ] 14.71% | 1,033 | 63.9% |
[ 16.0% - 16.5% ] 16.48% | 182 | 61.5% |
[ 18.5% - 19.0% ] 18.56% | 291 | 60.0% |
[ 20.5% - 21.0% ] 20.51% | 78 | 38.1% |
[ 26.0% - 26.5% ] 26.09% | 69 | 37.5% |
[ 37.0% - 37.5% ] 37.02% | 1,032 | 51.4% |
[ 37.0% - 37.5% ] 37.21% | 129 | 67.4% |
[ 48.0% - 48.5% ] 48.14% | 295 | 63.0% |