Senegalese vs Armenian Self-Care Disability
COMPARE
Senegalese
Armenian
Self-Care Disability
Self-Care Disability Comparison
Senegalese
Armenians
2.6%
SELF-CARE DISABILITY
1.3/ 100
METRIC RATING
238th/ 347
METRIC RANK
3.4%
SELF-CARE DISABILITY
0.0/ 100
METRIC RATING
345th/ 347
METRIC RANK
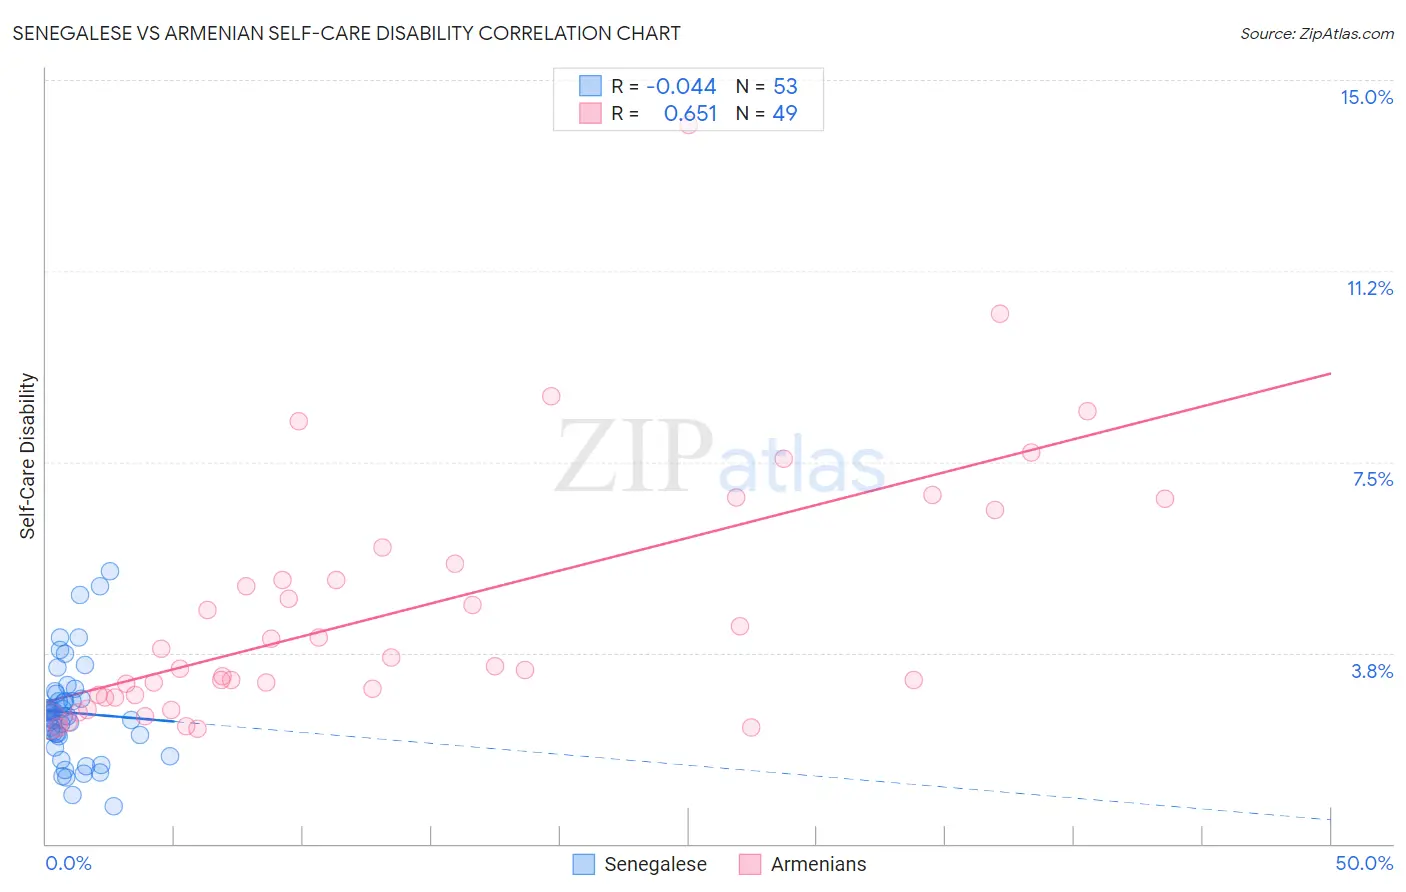
Senegalese vs Armenian Self-Care Disability Correlation Chart
The statistical analysis conducted on geographies consisting of 78,103,112 people shows no correlation between the proportion of Senegalese and percentage of population with self-care disability in the United States with a correlation coefficient (R) of -0.044 and weighted average of 2.6%. Similarly, the statistical analysis conducted on geographies consisting of 310,650,762 people shows a significant positive correlation between the proportion of Armenians and percentage of population with self-care disability in the United States with a correlation coefficient (R) of 0.651 and weighted average of 3.4%, a difference of 31.3%.
Self-Care Disability Correlation Summary
| Measurement | Senegalese | Armenian |
| Minimum | 0.74% | 2.3% |
| Maximum | 5.3% | 14.1% |
| Range | 4.6% | 11.8% |
| Mean | 2.6% | 4.6% |
| Median | 2.5% | 3.5% |
| Interquartile 25% (IQ1) | 2.1% | 2.9% |
| Interquartile 75% (IQ3) | 2.9% | 5.7% |
| Interquartile Range (IQR) | 0.77% | 2.8% |
| Standard Deviation (Sample) | 0.96% | 2.5% |
| Standard Deviation (Population) | 0.95% | 2.4% |
Similar Demographics by Self-Care Disability
Demographics Similar to Senegalese by Self-Care Disability
In terms of self-care disability, the demographic groups most similar to Senegalese are Immigrants from Panama (2.6%, a difference of 0.040%), Marshallese (2.6%, a difference of 0.070%), Immigrants from Syria (2.6%, a difference of 0.24%), Immigrants from Senegal (2.6%, a difference of 0.26%), and Bermudan (2.6%, a difference of 0.46%).
| Demographics | Rating | Rank | Self-Care Disability |
| Immigrants | Guatemala | 2.2 /100 | #231 | Tragic 2.6% |
| Albanians | 2.2 /100 | #232 | Tragic 2.6% |
| Liberians | 2.1 /100 | #233 | Tragic 2.6% |
| Vietnamese | 2.1 /100 | #234 | Tragic 2.6% |
| Bahamians | 2.0 /100 | #235 | Tragic 2.6% |
| Bermudans | 1.9 /100 | #236 | Tragic 2.6% |
| Immigrants | Senegal | 1.6 /100 | #237 | Tragic 2.6% |
| Senegalese | 1.3 /100 | #238 | Tragic 2.6% |
| Immigrants | Panama | 1.2 /100 | #239 | Tragic 2.6% |
| Marshallese | 1.2 /100 | #240 | Tragic 2.6% |
| Immigrants | Syria | 1.0 /100 | #241 | Tragic 2.6% |
| Spanish | 0.8 /100 | #242 | Tragic 2.6% |
| Hawaiians | 0.8 /100 | #243 | Tragic 2.6% |
| Yuman | 0.8 /100 | #244 | Tragic 2.6% |
| Immigrants | Western Asia | 0.6 /100 | #245 | Tragic 2.6% |
Demographics Similar to Armenians by Self-Care Disability
In terms of self-care disability, the demographic groups most similar to Armenians are Pueblo (3.3%, a difference of 4.5%), Puerto Rican (3.7%, a difference of 8.0%), Tohono O'odham (3.1%, a difference of 9.3%), Colville (3.1%, a difference of 9.4%), and Dominican (3.1%, a difference of 11.2%).
| Demographics | Rating | Rank | Self-Care Disability |
| Dutch West Indians | 0.0 /100 | #333 | Tragic 3.0% |
| Houma | 0.0 /100 | #334 | Tragic 3.0% |
| Immigrants | Azores | 0.0 /100 | #335 | Tragic 3.0% |
| Immigrants | Yemen | 0.0 /100 | #336 | Tragic 3.0% |
| Choctaw | 0.0 /100 | #337 | Tragic 3.0% |
| Cape Verdeans | 0.0 /100 | #338 | Tragic 3.0% |
| Immigrants | Dominican Republic | 0.0 /100 | #339 | Tragic 3.0% |
| Immigrants | Cabo Verde | 0.0 /100 | #340 | Tragic 3.1% |
| Dominicans | 0.0 /100 | #341 | Tragic 3.1% |
| Colville | 0.0 /100 | #342 | Tragic 3.1% |
| Tohono O'odham | 0.0 /100 | #343 | Tragic 3.1% |
| Pueblo | 0.0 /100 | #344 | Tragic 3.3% |
| Armenians | 0.0 /100 | #345 | Tragic 3.4% |
| Puerto Ricans | 0.0 /100 | #346 | Tragic 3.7% |
| Immigrants | Armenia | 0.0 /100 | #347 | Tragic 4.2% |