Immigrants from Sudan vs Irish Self-Care Disability

COMPARE

Immigrants from Sudan
Race
Ancestry
AfghanAfricanAlaska NativeAlaskan AthabascanAlbanianAleutAlsatianAmericanApacheArabArapahoArgentineanArmenianAssyrian/Chaldean/SyriacAustralianAustrianBahamianBangladeshiBarbadianBasqueBelgianBelizeanBermudanBhutaneseBlackfeetBolivianBrazilianBritishBritish West IndianBulgarianBurmeseCajunCambodianCanadianCape VerdeanCarpatho RusynCelticCentral AmericanCentral American IndianCherokeeCheyenneChickasawChileanChineseChippewaChoctawColombianColvilleComancheCosta RicanCreeCreekCroatianCrowCubanCypriotCzechCzechoslovakianDanishDelawareDominicanDutchDutch West IndianEastern EuropeanEcuadorianEgyptianEnglishEstonianEthiopianEuropeanFijianFilipinoFinnishFrenchFrench American IndianFrench CanadianGermanGerman RussianGhanaianGreekGuamanian/ChamorroGuatemalanGuyaneseHaitianHmongHonduranHopiHoumaHungarianIcelanderIndian (Asian)IndonesianInupiatIranianIraqiIroquoisIsraeliItalianJamaicanJapaneseJordanianKenyanKiowaKoreanLaotianLatvianLebaneseLiberianLithuanianLumbeeLuxembourgerMacedonianMalaysianMalteseMarshalleseMenomineeMexicanMexican American IndianMongolianMoroccanNative HawaiianNavajoNepaleseNew ZealanderNicaraguanNigerianNorthern EuropeanNorwegianOkinawanOsageOttawaPaiutePakistaniPalestinianPanamanianParaguayanPennsylvania GermanPeruvianPimaPolishPortuguesePotawatomiPuebloPuerto RicanPuget Sound SalishRomanianRussianSalvadoranSamoanScandinavianScotch-IrishScottishSeminoleSenegaleseSerbianShoshoneSierra LeoneanSiouxSlavicSlovakSloveneSomaliSouth AfricanSouth AmericanSouth American IndianSoviet UnionSpaniardSpanishSpanish AmericanSpanish American IndianSri LankanSubsaharan AfricanSudaneseSwedishSwissSyrianTaiwaneseThaiTlingit-HaidaTohono O'OdhamTonganTrinidadian and TobagonianTsimshianTurkishU.S. Virgin IslanderUgandanUkrainianUruguayanUteVenezuelanVietnameseWelshWest IndianYakamaYaquiYugoslavianYumanYup'ikZimbabwean
Immigration
NonimmigrantsImmigrantsAfghanistanAfricaAlbaniaArgentinaArmeniaAsiaAustraliaAustriaBahamasBangladeshBarbadosBelarusBelgiumBelizeBoliviaBosnia and HerzegovinaBrazilBulgariaBurma/MyanmarCabo VerdeCambodiaCameroonCanadaCaribbeanCentral AmericaChileChinaColombiaCongoCosta RicaCroatiaCubaCzechoslovakiaDenmarkDominicaDominican RepublicEastern AfricaEastern AsiaEastern EuropeEcuadorEgyptEl SalvadorEnglandEritreaEthiopiaEuropeFijiFranceGermanyGhanaGreeceGrenadaGuatemalaGuyanaHaitiHondurasHong KongHungaryIndiaIndonesiaIranIraqIrelandIsraelItalyJamaicaJapanJordanKazakhstanKenyaKoreaKuwaitLaosLatin AmericaLatviaLebanonLiberiaLithuaniaMalaysiaMexicoMicronesiaMiddle AfricaMoldovaMoroccoNepalNetherlandsNicaraguaNigeriaNorth AmericaNorth MacedoniaNorthern AfricaNorthern EuropeNorwayOceaniaPakistanPanamaPeruPhilippinesPolandPortugalRomaniaRussiaSaudi ArabiaScotlandSenegalSerbiaSierra LeoneSingaporeSomaliaSouth AfricaSouth AmericaSouth Central AsiaSouth Eastern AsiaSouthern EuropeSpainSri LankaSt. Vincent and the GrenadinesSudanSwedenSwitzerlandSyriaTaiwanThailandTrinidad and TobagoTurkeyUgandaUkraineUruguayUzbekistanVenezuelaVietnamWest IndiesWestern AfricaWestern AsiaWestern EuropeYemenZaireZimbabweAzores
Irish
Race
Ancestry
AfghanAfricanAlaska NativeAlaskan AthabascanAlbanianAleutAlsatianAmericanApacheArabArapahoArgentineanArmenianAssyrian/Chaldean/SyriacAustralianAustrianBahamianBangladeshiBarbadianBasqueBelgianBelizeanBermudanBhutaneseBlackfeetBolivianBrazilianBritishBritish West IndianBulgarianBurmeseCajunCambodianCanadianCape VerdeanCarpatho RusynCelticCentral AmericanCentral American IndianCherokeeCheyenneChickasawChileanChineseChippewaChoctawColombianColvilleComancheCosta RicanCreeCreekCroatianCrowCubanCypriotCzechCzechoslovakianDanishDelawareDominicanDutchDutch West IndianEastern EuropeanEcuadorianEgyptianEnglishEstonianEthiopianEuropeanFijianFilipinoFinnishFrenchFrench American IndianFrench CanadianGermanGerman RussianGhanaianGreekGuamanian/ChamorroGuatemalanGuyaneseHaitianHmongHonduranHopiHoumaHungarianIcelanderIndian (Asian)IndonesianInupiatIranianIraqiIrishIroquoisIsraeliItalianJamaicanJapaneseJordanianKenyanKiowaKoreanLaotianLatvianLebaneseLiberianLithuanianLumbeeLuxembourgerMacedonianMalaysianMalteseMarshalleseMenomineeMexicanMexican American IndianMongolianMoroccanNative HawaiianNavajoNepaleseNew ZealanderNicaraguanNigerianNorthern EuropeanNorwegianOkinawanOsageOttawaPaiutePakistaniPalestinianPanamanianParaguayanPennsylvania GermanPeruvianPimaPolishPortuguesePotawatomiPuebloPuerto RicanPuget Sound SalishRomanianRussianSalvadoranSamoanScandinavianScotch-IrishScottishSeminoleSenegaleseSerbianShoshoneSierra LeoneanSiouxSlavicSlovakSloveneSomaliSouth AfricanSouth AmericanSouth American IndianSoviet UnionSpaniardSpanishSpanish AmericanSpanish American IndianSri LankanSubsaharan AfricanSudaneseSwedishSwissSyrianTaiwaneseThaiTlingit-HaidaTohono O'OdhamTonganTrinidadian and TobagonianTsimshianTurkishU.S. Virgin IslanderUgandanUkrainianUruguayanUteVenezuelanVietnameseWelshWest IndianYakamaYaquiYugoslavianYumanYup'ikZimbabwean
Immigration
NonimmigrantsImmigrantsAfghanistanAfricaAlbaniaArgentinaArmeniaAsiaAustraliaAustriaBahamasBangladeshBarbadosBelarusBelgiumBelizeBoliviaBosnia and HerzegovinaBrazilBulgariaBurma/MyanmarCabo VerdeCambodiaCameroonCanadaCaribbeanCentral AmericaChileChinaColombiaCongoCosta RicaCroatiaCubaCzechoslovakiaDenmarkDominicaDominican RepublicEastern AfricaEastern AsiaEastern EuropeEcuadorEgyptEl SalvadorEnglandEritreaEthiopiaEuropeFijiFranceGermanyGhanaGreeceGrenadaGuatemalaGuyanaHaitiHondurasHong KongHungaryIndiaIndonesiaIranIraqIrelandIsraelItalyJamaicaJapanJordanKazakhstanKenyaKoreaKuwaitLaosLatin AmericaLatviaLebanonLiberiaLithuaniaMalaysiaMexicoMicronesiaMiddle AfricaMoldovaMoroccoNepalNetherlandsNicaraguaNigeriaNorth AmericaNorth MacedoniaNorthern AfricaNorthern EuropeNorwayOceaniaPakistanPanamaPeruPhilippinesPolandPortugalRomaniaRussiaSaudi ArabiaScotlandSenegalSerbiaSierra LeoneSingaporeSomaliaSouth AfricaSouth AmericaSouth Central AsiaSouth Eastern AsiaSouthern EuropeSpainSri LankaSt. Vincent and the GrenadinesSwedenSwitzerlandSyriaTaiwanThailandTrinidad and TobagoTurkeyUgandaUkraineUruguayUzbekistanVenezuelaVietnamWest IndiesWestern AfricaWestern AsiaWestern EuropeYemenZaireZimbabweAzores
Self-Care Disability
Income
Poverty
Unemployment
Labor Participation
Family Structure
Vehicle Availability
Education Level
Disability

Self-Care Disability Comparison

Immigrants from Sudan

Irish

Exceptional
Fair
2.3%
SELF-CARE DISABILITY
99.8/ 100
METRIC RATING
41st/ 347
METRIC RANK
2.5%
SELF-CARE DISABILITY
28.7/ 100
METRIC RATING
187th/ 347
METRIC RANK

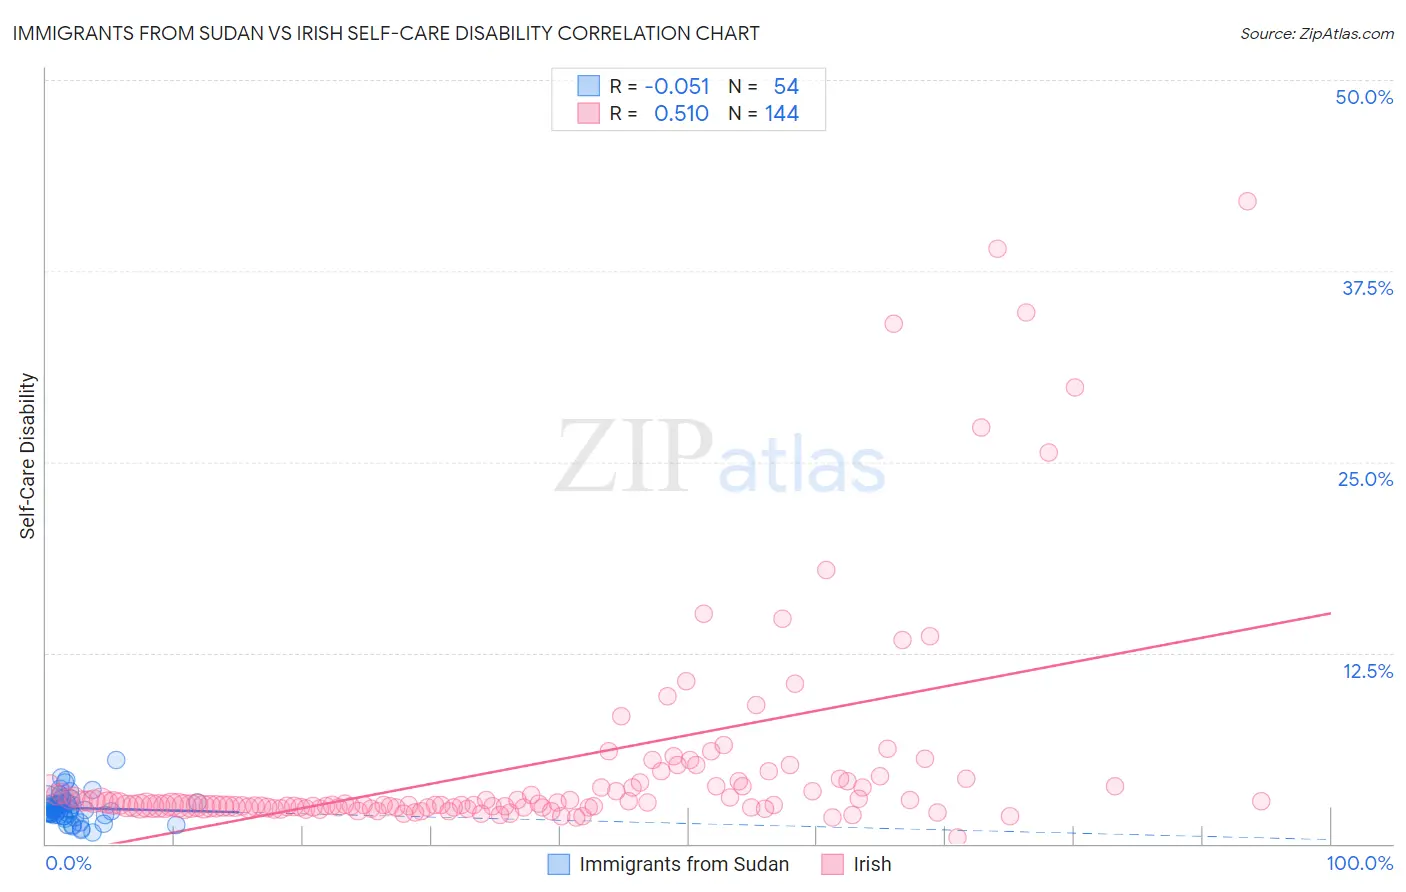
Immigrants from Sudan vs Irish Self-Care Disability Correlation Chart

The statistical analysis conducted on geographies consisting of 118,937,078 people shows a slight negative correlation between the proportion of Immigrants from Sudan and percentage of population with self-care disability in the United States with a correlation coefficient (R) of -0.051 and weighted average of 2.3%. Similarly, the statistical analysis conducted on geographies consisting of 577,353,633 people shows a substantial positive correlation between the proportion of Irish and percentage of population with self-care disability in the United States with a correlation coefficient (R) of 0.510 and weighted average of 2.5%, a difference of 9.4%.
Immigrants from Sudan vs Irish Self-Care Disability

Self-Care Disability Correlation Summary

MeasurementImmigrants from SudanIrish
Minimum0.73%0.44%
Maximum5.5%42.0%
Range4.8%41.6%
Mean2.3%5.0%
Median2.2%2.6%
Interquartile 25% (IQ1)1.9%2.4%
Interquartile 75% (IQ3)2.6%3.9%
Interquartile Range (IQR)0.77%1.5%
Standard Deviation (Sample)0.91%7.0%
Standard Deviation (Population)0.90%7.0%

Similar Demographics by Self-Care Disability

Demographics Similar to Immigrants from Sudan by Self-Care Disability

In terms of self-care disability, the demographic groups most similar to Immigrants from Sudan are Iranian (2.3%, a difference of 0.070%), Immigrants from Uganda (2.3%, a difference of 0.10%), Immigrants from Bulgaria (2.3%, a difference of 0.11%), Immigrants from Pakistan (2.3%, a difference of 0.14%), and Immigrants from South Africa (2.3%, a difference of 0.19%).
DemographicsRating | RankSelf-Care Disability
Immigrants | Turkey
99.9
/100
|
#34
Exceptional
2.3%
Immigrants | Australia
99.9
/100
|
#35
Exceptional
2.3%
Immigrants | Lithuania
99.9
/100
|
#36
Exceptional
2.3%
Immigrants | Sweden
99.9
/100
|
#37
Exceptional
2.3%
Immigrants | Eastern Africa
99.9
/100
|
#38
Exceptional
2.3%
Immigrants | Bulgaria
99.8
/100
|
#39
Exceptional
2.3%
Iranians
99.8
/100
|
#40
Exceptional
2.3%
Immigrants | Sudan
99.8
/100
|
#41
Exceptional
2.3%
Immigrants | Uganda
99.8
/100
|
#42
Exceptional
2.3%
Immigrants | Pakistan
99.8
/100
|
#43
Exceptional
2.3%
Immigrants | South Africa
99.8
/100
|
#44
Exceptional
2.3%
Norwegians
99.8
/100
|
#45
Exceptional
2.3%
Czechs
99.8
/100
|
#46
Exceptional
2.3%
Jordanians
99.7
/100
|
#47
Exceptional
2.3%
Immigrants | Malaysia
99.7
/100
|
#48
Exceptional
2.3%

Demographics Similar to Irish by Self-Care Disability

In terms of self-care disability, the demographic groups most similar to Irish are Immigrants from Oceania (2.5%, a difference of 0.030%), Immigrants from Eastern Europe (2.5%, a difference of 0.040%), Immigrants from El Salvador (2.5%, a difference of 0.23%), Sioux (2.5%, a difference of 0.25%), and Slavic (2.5%, a difference of 0.31%).
DemographicsRating | RankSelf-Care Disability
Indonesians
41.2
/100
|
#180
Average
2.5%
Ghanaians
40.4
/100
|
#181
Average
2.5%
Maltese
37.5
/100
|
#182
Fair
2.5%
Salvadorans
36.4
/100
|
#183
Fair
2.5%
Yugoslavians
36.1
/100
|
#184
Fair
2.5%
Slavs
34.3
/100
|
#185
Fair
2.5%
Immigrants | El Salvador
33.0
/100
|
#186
Fair
2.5%
Irish
28.7
/100
|
#187
Fair
2.5%
Immigrants | Oceania
28.3
/100
|
#188
Fair
2.5%
Immigrants | Eastern Europe
28.0
/100
|
#189
Fair
2.5%
Sioux
24.6
/100
|
#190
Fair
2.5%
Moroccans
22.9
/100
|
#191
Fair
2.5%
Soviet Union
22.2
/100
|
#192
Fair
2.5%
Ukrainians
21.4
/100
|
#193
Fair
2.5%
Immigrants | Germany
17.9
/100
|
#194
Poor
2.5%