Immigrants from Liberia vs Immigrants from Guatemala Self-Care Disability
COMPARE
Immigrants from Liberia
Immigrants from Guatemala
Self-Care Disability
Self-Care Disability Comparison
Immigrants from Liberia
Immigrants from Guatemala
2.6%
SELF-CARE DISABILITY
0.4/ 100
METRIC RATING
251st/ 347
METRIC RANK
2.6%
SELF-CARE DISABILITY
2.2/ 100
METRIC RATING
231st/ 347
METRIC RANK
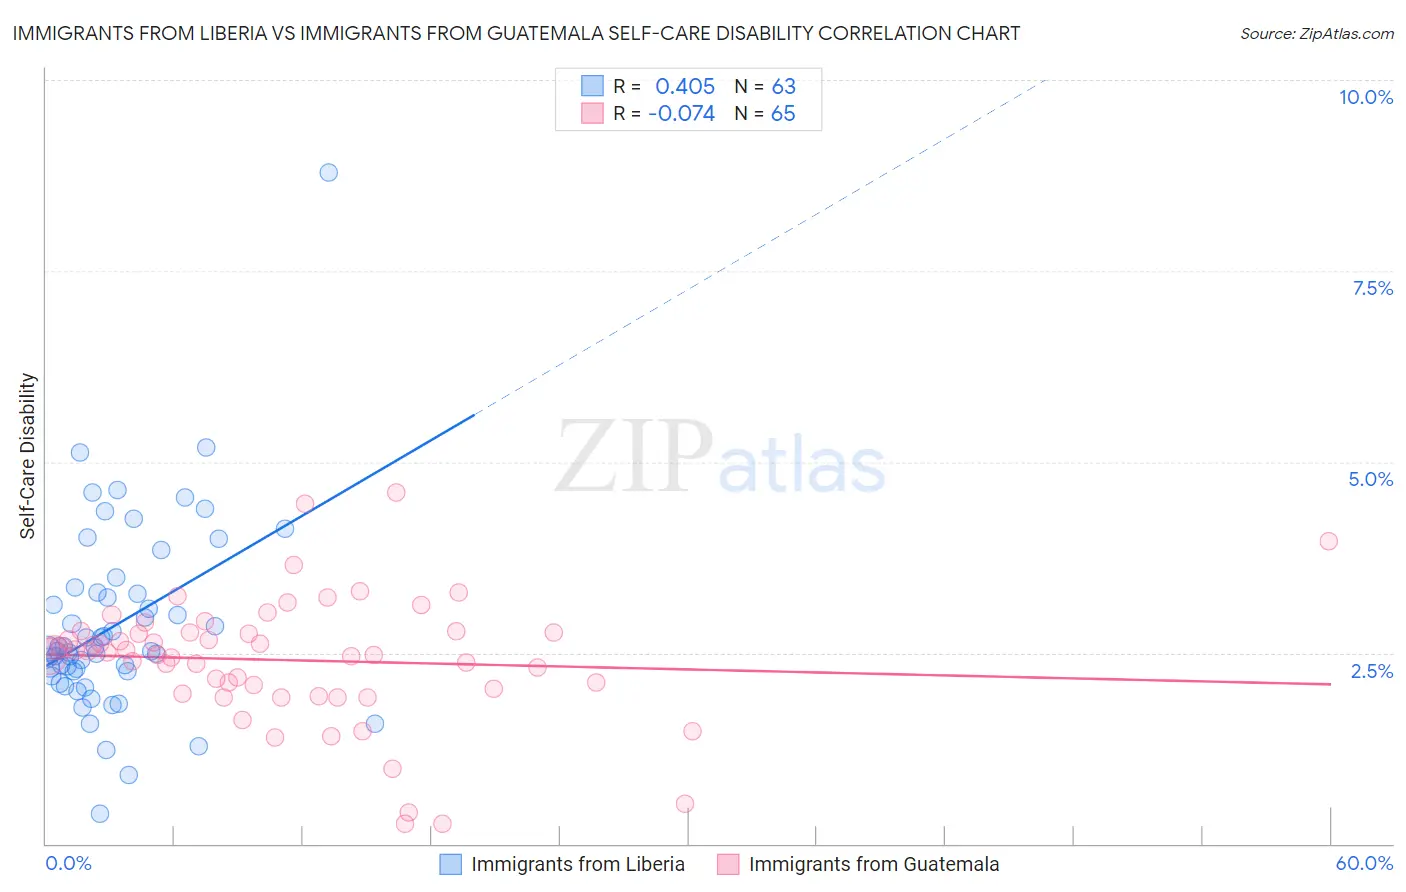
Immigrants from Liberia vs Immigrants from Guatemala Self-Care Disability Correlation Chart
The statistical analysis conducted on geographies consisting of 135,176,274 people shows a moderate positive correlation between the proportion of Immigrants from Liberia and percentage of population with self-care disability in the United States with a correlation coefficient (R) of 0.405 and weighted average of 2.6%. Similarly, the statistical analysis conducted on geographies consisting of 376,972,339 people shows a slight negative correlation between the proportion of Immigrants from Guatemala and percentage of population with self-care disability in the United States with a correlation coefficient (R) of -0.074 and weighted average of 2.6%, a difference of 2.0%.
Self-Care Disability Correlation Summary
| Measurement | Immigrants from Liberia | Immigrants from Guatemala |
| Minimum | 0.40% | 0.26% |
| Maximum | 8.8% | 4.6% |
| Range | 8.4% | 4.3% |
| Mean | 2.9% | 2.4% |
| Median | 2.6% | 2.5% |
| Interquartile 25% (IQ1) | 2.3% | 2.0% |
| Interquartile 75% (IQ3) | 3.3% | 2.8% |
| Interquartile Range (IQR) | 1.0% | 0.77% |
| Standard Deviation (Sample) | 1.3% | 0.84% |
| Standard Deviation (Population) | 1.2% | 0.83% |
Demographics Similar to Immigrants from Liberia and Immigrants from Guatemala by Self-Care Disability
In terms of self-care disability, the demographic groups most similar to Immigrants from Liberia are Portuguese (2.6%, a difference of 0.080%), Mexican American Indian (2.6%, a difference of 0.16%), Immigrants from Albania (2.6%, a difference of 0.40%), Nicaraguan (2.6%, a difference of 0.40%), and Cheyenne (2.6%, a difference of 0.53%). Similarly, the demographic groups most similar to Immigrants from Guatemala are Albanian (2.6%, a difference of 0.030%), Liberian (2.6%, a difference of 0.070%), Vietnamese (2.6%, a difference of 0.070%), Bahamian (2.6%, a difference of 0.11%), and Bermudan (2.6%, a difference of 0.18%).
| Demographics | Rating | Rank | Self-Care Disability |
| Immigrants | Guatemala | 2.2 /100 | #231 | Tragic 2.6% |
| Albanians | 2.2 /100 | #232 | Tragic 2.6% |
| Liberians | 2.1 /100 | #233 | Tragic 2.6% |
| Vietnamese | 2.1 /100 | #234 | Tragic 2.6% |
| Bahamians | 2.0 /100 | #235 | Tragic 2.6% |
| Bermudans | 1.9 /100 | #236 | Tragic 2.6% |
| Immigrants | Senegal | 1.6 /100 | #237 | Tragic 2.6% |
| Senegalese | 1.3 /100 | #238 | Tragic 2.6% |
| Immigrants | Panama | 1.2 /100 | #239 | Tragic 2.6% |
| Marshallese | 1.2 /100 | #240 | Tragic 2.6% |
| Immigrants | Syria | 1.0 /100 | #241 | Tragic 2.6% |
| Spanish | 0.8 /100 | #242 | Tragic 2.6% |
| Hawaiians | 0.8 /100 | #243 | Tragic 2.6% |
| Yuman | 0.8 /100 | #244 | Tragic 2.6% |
| Immigrants | Western Asia | 0.6 /100 | #245 | Tragic 2.6% |
| Cheyenne | 0.6 /100 | #246 | Tragic 2.6% |
| Immigrants | Albania | 0.6 /100 | #247 | Tragic 2.6% |
| Nicaraguans | 0.6 /100 | #248 | Tragic 2.6% |
| Mexican American Indians | 0.5 /100 | #249 | Tragic 2.6% |
| Portuguese | 0.4 /100 | #250 | Tragic 2.6% |
| Immigrants | Liberia | 0.4 /100 | #251 | Tragic 2.6% |