Immigrants from Kenya Wage/Income Gap

COMPARE

Immigrants from Kenya
Race
Ancestry
AfghanAfricanAlaska NativeAlaskan AthabascanAlbanianAleutAlsatianAmericanApacheArabArapahoArgentineanArmenianAssyrian/Chaldean/SyriacAustralianAustrianBahamianBangladeshiBarbadianBasqueBelgianBelizeanBermudanBhutaneseBlackfeetBolivianBrazilianBritishBritish West IndianBulgarianBurmeseCajunCambodianCanadianCape VerdeanCarpatho RusynCelticCentral AmericanCentral American IndianCherokeeCheyenneChickasawChileanChineseChippewaChoctawColombianColvilleComancheCosta RicanCreeCreekCroatianCrowCubanCypriotCzechCzechoslovakianDanishDelawareDominicanDutchDutch West IndianEastern EuropeanEcuadorianEgyptianEnglishEstonianEthiopianEuropeanFijianFilipinoFinnishFrenchFrench American IndianFrench CanadianGermanGerman RussianGhanaianGreekGuamanian/ChamorroGuatemalanGuyaneseHaitianHmongHonduranHopiHoumaHungarianIcelanderIndian (Asian)IndonesianInupiatIranianIraqiIrishIroquoisIsraeliItalianJamaicanJapaneseJordanianKenyanKiowaKoreanLaotianLatvianLebaneseLiberianLithuanianLumbeeLuxembourgerMacedonianMalaysianMalteseMarshalleseMenomineeMexicanMexican American IndianMongolianMoroccanNative HawaiianNavajoNepaleseNew ZealanderNicaraguanNigerianNorthern EuropeanNorwegianOkinawanOsageOttawaPaiutePakistaniPalestinianPanamanianParaguayanPennsylvania GermanPeruvianPimaPolishPortuguesePotawatomiPuebloPuerto RicanPuget Sound SalishRomanianRussianSalvadoranSamoanScandinavianScotch-IrishScottishSeminoleSenegaleseSerbianShoshoneSierra LeoneanSiouxSlavicSlovakSloveneSomaliSouth AfricanSouth AmericanSouth American IndianSoviet UnionSpaniardSpanishSpanish AmericanSpanish American IndianSri LankanSubsaharan AfricanSudaneseSwedishSwissSyrianTaiwaneseThaiTlingit-HaidaTohono O'OdhamTonganTrinidadian and TobagonianTsimshianTurkishU.S. Virgin IslanderUgandanUkrainianUruguayanUteVenezuelanVietnameseWelshWest IndianYakamaYaquiYugoslavianYumanYup'ikZimbabwean
Immigration
NonimmigrantsImmigrantsAfghanistanAfricaAlbaniaArgentinaArmeniaAsiaAustraliaAustriaBahamasBangladeshBarbadosBelarusBelgiumBelizeBoliviaBosnia and HerzegovinaBrazilBulgariaBurma/MyanmarCabo VerdeCambodiaCameroonCanadaCaribbeanCentral AmericaChileChinaColombiaCongoCosta RicaCroatiaCubaCzechoslovakiaDenmarkDominicaDominican RepublicEastern AfricaEastern AsiaEastern EuropeEcuadorEgyptEl SalvadorEnglandEritreaEthiopiaEuropeFijiFranceGermanyGhanaGreeceGrenadaGuatemalaGuyanaHaitiHondurasHong KongHungaryIndiaIndonesiaIranIraqIrelandIsraelItalyJamaicaJapanJordanKazakhstanKenyaKoreaKuwaitLaosLatin AmericaLatviaLebanonLiberiaLithuaniaMalaysiaMexicoMicronesiaMiddle AfricaMoldovaMoroccoNepalNetherlandsNicaraguaNigeriaNorth AmericaNorth MacedoniaNorthern AfricaNorthern EuropeNorwayOceaniaPakistanPanamaPeruPhilippinesPolandPortugalRomaniaRussiaSaudi ArabiaScotlandSenegalSerbiaSierra LeoneSingaporeSomaliaSouth AfricaSouth AmericaSouth Central AsiaSouth Eastern AsiaSouthern EuropeSpainSri LankaSt. Vincent and the GrenadinesSudanSwedenSwitzerlandSyriaTaiwanThailandTrinidad and TobagoTurkeyUgandaUkraineUruguayUzbekistanVenezuelaVietnamWest IndiesWestern AfricaWestern AsiaWestern EuropeYemenZaireZimbabweAzores
Select to Compare
Race
Ancestry
AfghanAfricanAlaska NativeAlaskan AthabascanAlbanianAleutAlsatianAmericanApacheArabArapahoArgentineanArmenianAssyrian/Chaldean/SyriacAustralianAustrianBahamianBangladeshiBarbadianBasqueBelgianBelizeanBermudanBhutaneseBlackfeetBolivianBrazilianBritishBritish West IndianBulgarianBurmeseCajunCambodianCanadianCape VerdeanCarpatho RusynCelticCentral AmericanCentral American IndianCherokeeCheyenneChickasawChileanChineseChippewaChoctawColombianColvilleComancheCosta RicanCreeCreekCroatianCrowCubanCypriotCzechCzechoslovakianDanishDelawareDominicanDutchDutch West IndianEastern EuropeanEcuadorianEgyptianEnglishEstonianEthiopianEuropeanFijianFilipinoFinnishFrenchFrench American IndianFrench CanadianGermanGerman RussianGhanaianGreekGuamanian/ChamorroGuatemalanGuyaneseHaitianHmongHonduranHopiHoumaHungarianIcelanderIndian (Asian)IndonesianInupiatIranianIraqiIrishIroquoisIsraeliItalianJamaicanJapaneseJordanianKenyanKiowaKoreanLaotianLatvianLebaneseLiberianLithuanianLumbeeLuxembourgerMacedonianMalaysianMalteseMarshalleseMenomineeMexicanMexican American IndianMongolianMoroccanNative HawaiianNavajoNepaleseNew ZealanderNicaraguanNigerianNorthern EuropeanNorwegianOkinawanOsageOttawaPaiutePakistaniPalestinianPanamanianParaguayanPennsylvania GermanPeruvianPimaPolishPortuguesePotawatomiPuebloPuerto RicanPuget Sound SalishRomanianRussianSalvadoranSamoanScandinavianScotch-IrishScottishSeminoleSenegaleseSerbianShoshoneSierra LeoneanSiouxSlavicSlovakSloveneSomaliSouth AfricanSouth AmericanSouth American IndianSoviet UnionSpaniardSpanishSpanish AmericanSpanish American IndianSri LankanSubsaharan AfricanSudaneseSwedishSwissSyrianTaiwaneseThaiTlingit-HaidaTohono O'OdhamTonganTrinidadian and TobagonianTsimshianTurkishU.S. Virgin IslanderUgandanUkrainianUruguayanUteVenezuelanVietnameseWelshWest IndianYakamaYaquiYugoslavianYumanYup'ikZimbabwean
Immigration
NonimmigrantsImmigrantsAfghanistanAfricaAlbaniaArgentinaArmeniaAsiaAustraliaAustriaBahamasBangladeshBarbadosBelarusBelgiumBelizeBoliviaBosnia and HerzegovinaBrazilBulgariaBurma/MyanmarCabo VerdeCambodiaCameroonCanadaCaribbeanCentral AmericaChileChinaColombiaCongoCosta RicaCroatiaCubaCzechoslovakiaDenmarkDominicaDominican RepublicEastern AfricaEastern AsiaEastern EuropeEcuadorEgyptEl SalvadorEnglandEritreaEthiopiaEuropeFijiFranceGermanyGhanaGreeceGrenadaGuatemalaGuyanaHaitiHondurasHong KongHungaryIndiaIndonesiaIranIraqIrelandIsraelItalyJamaicaJapanJordanKazakhstanKoreaKuwaitLaosLatin AmericaLatviaLebanonLiberiaLithuaniaMalaysiaMexicoMicronesiaMiddle AfricaMoldovaMoroccoNepalNetherlandsNicaraguaNigeriaNorth AmericaNorth MacedoniaNorthern AfricaNorthern EuropeNorwayOceaniaPakistanPanamaPeruPhilippinesPolandPortugalRomaniaRussiaSaudi ArabiaScotlandSenegalSerbiaSierra LeoneSingaporeSomaliaSouth AfricaSouth AmericaSouth Central AsiaSouth Eastern AsiaSouthern EuropeSpainSri LankaSt. Vincent and the GrenadinesSudanSwedenSwitzerlandSyriaTaiwanThailandTrinidad and TobagoTurkeyUgandaUkraineUruguayUzbekistanVenezuelaVietnamWest IndiesWestern AfricaWestern AsiaWestern EuropeYemenZaireZimbabweAzores
Wage/Income Gap
Income
Poverty
Unemployment
Labor Participation
Family Structure
Vehicle Availability
Education Level
Disability

Immigrants from Kenya Wage/Income Gap
Exceptional

24.4%
WAGE/INCOME GAP
96.4/ 100
METRIC RATING
115th/ 347
METRIC RANK

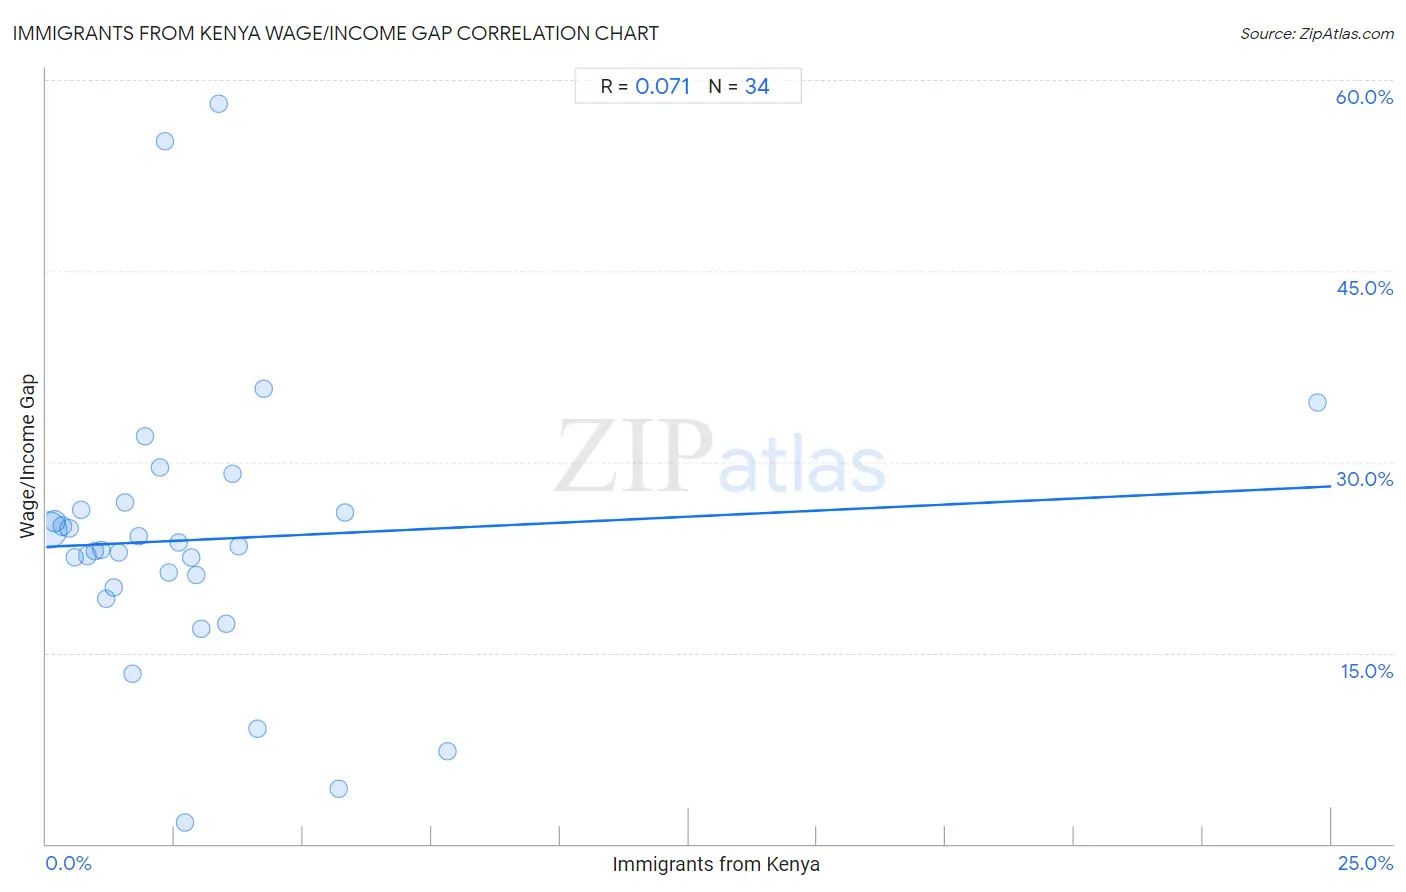
Immigrants from Kenya Wage/Income Gap Correlation Chart

The statistical analysis conducted on geographies consisting of 218,055,020 people shows a slight positive correlation between the proportion of Immigrants from Kenya and wage/income gap percentage in the United States with a correlation coefficient (R) of 0.071 and weighted average of 24.4%. On average, for every 1% (one percent) increase in Immigrants from Kenya within a typical geography, there is an increase of 0.19% in wage/income gap percentage.
Immigrants from Kenya Wage/Income Gap
It is essential to understand that the correlation between the percentage of Immigrants from Kenya and wage/income gap percentage does not imply a direct cause-and-effect relationship. It remains uncertain whether the presence of Immigrants from Kenya influences an upward or downward trend in the level of wage/income gap percentage within an area, or if Immigrants from Kenya simply ended up residing in those areas with higher or lower levels of wage/income gap percentage due to other factors.

Demographics Similar to Immigrants from Kenya by Wage/Income Gap

In terms of wage/income gap, the demographic groups most similar to Immigrants from Kenya are Panamanian (24.4%, a difference of 0.060%), Alaska Native (24.4%, a difference of 0.17%), Immigrants from Afghanistan (24.4%, a difference of 0.23%), Sioux (24.3%, a difference of 0.26%), and Immigrants from Micronesia (24.4%, a difference of 0.26%).
DemographicsRating | RankWage/Income Gap
Immigrants from Albania
98.4
/100
|
#108
Exceptional
24.0%
Ugandans
98.3
/100
|
#109
Exceptional
24.1%
Immigrants from Morocco
98.1
/100
|
#110
Exceptional
24.1%
Soviet Union
97.6
/100
|
#111
Exceptional
24.2%
Immigrants from Colombia
97.0
/100
|
#112
Exceptional
24.3%
Sioux
96.9
/100
|
#113
Exceptional
24.3%
Panamanians
96.5
/100
|
#114
Exceptional
24.4%
Immigrants from Kenya
96.4
/100
|
#115
Exceptional
24.4%
Alaska Natives
96.0
/100
|
#116
Exceptional
24.4%
Immigrants from Afghanistan
95.9
/100
|
#117
Exceptional
24.4%
Immigrants from Micronesia
95.8
/100
|
#118
Exceptional
24.4%
Kenyans
95.8
/100
|
#119
Exceptional
24.5%
Cree
95.6
/100
|
#120
Exceptional
24.5%
Immigrants from Thailand
94.9
/100
|
#121
Exceptional
24.5%
Apache
94.8
/100
|
#122
Exceptional
24.5%

Immigrants from Kenya Wage/Income Gap Correlation Summary

MeasurementImmigrants from Kenya DataWage/Income Gap Data
Minimum0.045%1.6%
Maximum24.7%58.2%
Range24.7%56.5%
Mean3.0%23.9%
Median2.3%23.2%
Interquartile 25% (IQ1)1.1%20.1%
Interquartile 75% (IQ3)3.5%26.2%
Interquartile Range (IQR)2.4%6.1%
Standard Deviation (Sample)4.2%11.3%
Standard Deviation (Population)4.2%11.1%

Correlation Details

Immigrants from Kenya PercentileSample SizeWage/Income Gap
[
0.0%
-
0.5%
]
0.045%
154,724,50524.7%
[
0.0%
-
0.5%
]
0.17%
33,145,32125.3%
[
0.0%
-
0.5%
]
0.31%
12,127,50125.0%
[
0.0%
-
0.5%
]
0.44%
6,463,09324.8%
[
0.5%
-
1.0%
]
0.56%
3,979,93322.5%
[
0.5%
-
1.0%
]
0.67%
1,896,71326.2%
[
0.5%
-
1.0%
]
0.79%
1,466,14222.6%
[
0.5%
-
1.0%
]
0.94%
983,48923.0%
[
1.0%
-
1.5%
]
1.06%
827,35223.1%
[
1.0%
-
1.5%
]
1.16%
572,15119.2%
[
1.0%
-
1.5%
]
1.30%
390,78220.1%
[
1.0%
-
1.5%
]
1.42%
305,22722.9%
[
1.5%
-
2.0%
]
1.53%
264,98526.8%
[
1.5%
-
2.0%
]
1.68%
109,72813.3%
[
1.5%
-
2.0%
]
1.79%
229,90424.2%
[
1.5%
-
2.0%
]
1.92%
113,72032.0%
[
2.0%
-
2.5%
]
2.20%
189,88429.6%
[
2.0%
-
2.5%
]
2.30%
10,02655.2%
[
2.0%
-
2.5%
]
2.39%
55,33221.3%
[
2.5%
-
3.0%
]
2.58%
28,69323.6%
[
2.5%
-
3.0%
]
2.70%
16,0861.6%
[
2.5%
-
3.0%
]
2.82%
61,57822.5%
[
2.5%
-
3.0%
]
2.93%
16,88421.1%
[
3.0%
-
3.5%
]
3.02%
15,65016.9%
[
3.0%
-
3.5%
]
3.36%
2,61858.2%
[
3.0%
-
3.5%
]
3.50%
3,97617.3%
[
3.5%
-
4.0%
]
3.62%
8,89229.1%
[
3.5%
-
4.0%
]
3.74%
10,81123.4%
[
4.0%
-
4.5%
]
4.10%
2,4649.0%
[
4.0%
-
4.5%
]
4.23%
24,00835.8%
[
5.5%
-
6.0%
]
5.68%
3,8384.3%
[
5.5%
-
6.0%
]
5.82%
3,21426.0%
[
7.5%
-
8.0%
]
7.80%
4237.3%
[
24.5%
-
25.0%
]
24.74%
9734.7%