Immigrants from Kenya 2 or more Vehicles in Household

COMPARE

Immigrants from Kenya
Race
Ancestry
AfghanAfricanAlaska NativeAlaskan AthabascanAlbanianAleutAlsatianAmericanApacheArabArapahoArgentineanArmenianAssyrian/Chaldean/SyriacAustralianAustrianBahamianBangladeshiBarbadianBasqueBelgianBelizeanBermudanBhutaneseBlackfeetBolivianBrazilianBritishBritish West IndianBulgarianBurmeseCajunCambodianCanadianCape VerdeanCarpatho RusynCelticCentral AmericanCentral American IndianCherokeeCheyenneChickasawChileanChineseChippewaChoctawColombianColvilleComancheCosta RicanCreeCreekCroatianCrowCubanCypriotCzechCzechoslovakianDanishDelawareDominicanDutchDutch West IndianEastern EuropeanEcuadorianEgyptianEnglishEstonianEthiopianEuropeanFijianFilipinoFinnishFrenchFrench American IndianFrench CanadianGermanGerman RussianGhanaianGreekGuamanian/ChamorroGuatemalanGuyaneseHaitianHmongHonduranHopiHoumaHungarianIcelanderIndian (Asian)IndonesianInupiatIranianIraqiIrishIroquoisIsraeliItalianJamaicanJapaneseJordanianKenyanKiowaKoreanLaotianLatvianLebaneseLiberianLithuanianLumbeeLuxembourgerMacedonianMalaysianMalteseMarshalleseMenomineeMexicanMexican American IndianMongolianMoroccanNative HawaiianNavajoNepaleseNew ZealanderNicaraguanNigerianNorthern EuropeanNorwegianOkinawanOsageOttawaPaiutePakistaniPalestinianPanamanianParaguayanPennsylvania GermanPeruvianPimaPolishPortuguesePotawatomiPuebloPuerto RicanPuget Sound SalishRomanianRussianSalvadoranSamoanScandinavianScotch-IrishScottishSeminoleSenegaleseSerbianShoshoneSierra LeoneanSiouxSlavicSlovakSloveneSomaliSouth AfricanSouth AmericanSouth American IndianSoviet UnionSpaniardSpanishSpanish AmericanSpanish American IndianSri LankanSubsaharan AfricanSudaneseSwedishSwissSyrianTaiwaneseThaiTlingit-HaidaTohono O'OdhamTonganTrinidadian and TobagonianTsimshianTurkishU.S. Virgin IslanderUgandanUkrainianUruguayanUteVenezuelanVietnameseWelshWest IndianYakamaYaquiYugoslavianYumanYup'ikZimbabwean
Immigration
NonimmigrantsImmigrantsAfghanistanAfricaAlbaniaArgentinaArmeniaAsiaAustraliaAustriaBahamasBangladeshBarbadosBelarusBelgiumBelizeBoliviaBosnia and HerzegovinaBrazilBulgariaBurma/MyanmarCabo VerdeCambodiaCameroonCanadaCaribbeanCentral AmericaChileChinaColombiaCongoCosta RicaCroatiaCubaCzechoslovakiaDenmarkDominicaDominican RepublicEastern AfricaEastern AsiaEastern EuropeEcuadorEgyptEl SalvadorEnglandEritreaEthiopiaEuropeFijiFranceGermanyGhanaGreeceGrenadaGuatemalaGuyanaHaitiHondurasHong KongHungaryIndiaIndonesiaIranIraqIrelandIsraelItalyJamaicaJapanJordanKazakhstanKenyaKoreaKuwaitLaosLatin AmericaLatviaLebanonLiberiaLithuaniaMalaysiaMexicoMicronesiaMiddle AfricaMoldovaMoroccoNepalNetherlandsNicaraguaNigeriaNorth AmericaNorth MacedoniaNorthern AfricaNorthern EuropeNorwayOceaniaPakistanPanamaPeruPhilippinesPolandPortugalRomaniaRussiaSaudi ArabiaScotlandSenegalSerbiaSierra LeoneSingaporeSomaliaSouth AfricaSouth AmericaSouth Central AsiaSouth Eastern AsiaSouthern EuropeSpainSri LankaSt. Vincent and the GrenadinesSudanSwedenSwitzerlandSyriaTaiwanThailandTrinidad and TobagoTurkeyUgandaUkraineUruguayUzbekistanVenezuelaVietnamWest IndiesWestern AfricaWestern AsiaWestern EuropeYemenZaireZimbabweAzores
Select to Compare
Race
Ancestry
AfghanAfricanAlaska NativeAlaskan AthabascanAlbanianAleutAlsatianAmericanApacheArabArapahoArgentineanArmenianAssyrian/Chaldean/SyriacAustralianAustrianBahamianBangladeshiBarbadianBasqueBelgianBelizeanBermudanBhutaneseBlackfeetBolivianBrazilianBritishBritish West IndianBulgarianBurmeseCajunCambodianCanadianCape VerdeanCarpatho RusynCelticCentral AmericanCentral American IndianCherokeeCheyenneChickasawChileanChineseChippewaChoctawColombianColvilleComancheCosta RicanCreeCreekCroatianCrowCubanCypriotCzechCzechoslovakianDanishDelawareDominicanDutchDutch West IndianEastern EuropeanEcuadorianEgyptianEnglishEstonianEthiopianEuropeanFijianFilipinoFinnishFrenchFrench American IndianFrench CanadianGermanGerman RussianGhanaianGreekGuamanian/ChamorroGuatemalanGuyaneseHaitianHmongHonduranHopiHoumaHungarianIcelanderIndian (Asian)IndonesianInupiatIranianIraqiIrishIroquoisIsraeliItalianJamaicanJapaneseJordanianKenyanKiowaKoreanLaotianLatvianLebaneseLiberianLithuanianLumbeeLuxembourgerMacedonianMalaysianMalteseMarshalleseMenomineeMexicanMexican American IndianMongolianMoroccanNative HawaiianNavajoNepaleseNew ZealanderNicaraguanNigerianNorthern EuropeanNorwegianOkinawanOsageOttawaPaiutePakistaniPalestinianPanamanianParaguayanPennsylvania GermanPeruvianPimaPolishPortuguesePotawatomiPuebloPuerto RicanPuget Sound SalishRomanianRussianSalvadoranSamoanScandinavianScotch-IrishScottishSeminoleSenegaleseSerbianShoshoneSierra LeoneanSiouxSlavicSlovakSloveneSomaliSouth AfricanSouth AmericanSouth American IndianSoviet UnionSpaniardSpanishSpanish AmericanSpanish American IndianSri LankanSubsaharan AfricanSudaneseSwedishSwissSyrianTaiwaneseThaiTlingit-HaidaTohono O'OdhamTonganTrinidadian and TobagonianTsimshianTurkishU.S. Virgin IslanderUgandanUkrainianUruguayanUteVenezuelanVietnameseWelshWest IndianYakamaYaquiYugoslavianYumanYup'ikZimbabwean
Immigration
NonimmigrantsImmigrantsAfghanistanAfricaAlbaniaArgentinaArmeniaAsiaAustraliaAustriaBahamasBangladeshBarbadosBelarusBelgiumBelizeBoliviaBosnia and HerzegovinaBrazilBulgariaBurma/MyanmarCabo VerdeCambodiaCameroonCanadaCaribbeanCentral AmericaChileChinaColombiaCongoCosta RicaCroatiaCubaCzechoslovakiaDenmarkDominicaDominican RepublicEastern AfricaEastern AsiaEastern EuropeEcuadorEgyptEl SalvadorEnglandEritreaEthiopiaEuropeFijiFranceGermanyGhanaGreeceGrenadaGuatemalaGuyanaHaitiHondurasHong KongHungaryIndiaIndonesiaIranIraqIrelandIsraelItalyJamaicaJapanJordanKazakhstanKoreaKuwaitLaosLatin AmericaLatviaLebanonLiberiaLithuaniaMalaysiaMexicoMicronesiaMiddle AfricaMoldovaMoroccoNepalNetherlandsNicaraguaNigeriaNorth AmericaNorth MacedoniaNorthern AfricaNorthern EuropeNorwayOceaniaPakistanPanamaPeruPhilippinesPolandPortugalRomaniaRussiaSaudi ArabiaScotlandSenegalSerbiaSierra LeoneSingaporeSomaliaSouth AfricaSouth AmericaSouth Central AsiaSouth Eastern AsiaSouthern EuropeSpainSri LankaSt. Vincent and the GrenadinesSudanSwedenSwitzerlandSyriaTaiwanThailandTrinidad and TobagoTurkeyUgandaUkraineUruguayUzbekistanVenezuelaVietnamWest IndiesWestern AfricaWestern AsiaWestern EuropeYemenZaireZimbabweAzores
2 or more Vehicles in Household
Income
Poverty
Unemployment
Labor Participation
Family Structure
Vehicle Availability
Education Level
Disability

Immigrants from Kenya 2 or more Vehicles in Household
Average

55.1%
2+ VEHICLES AVAILABLE
40.4/ 100
METRIC RATING
180th/ 347
METRIC RANK

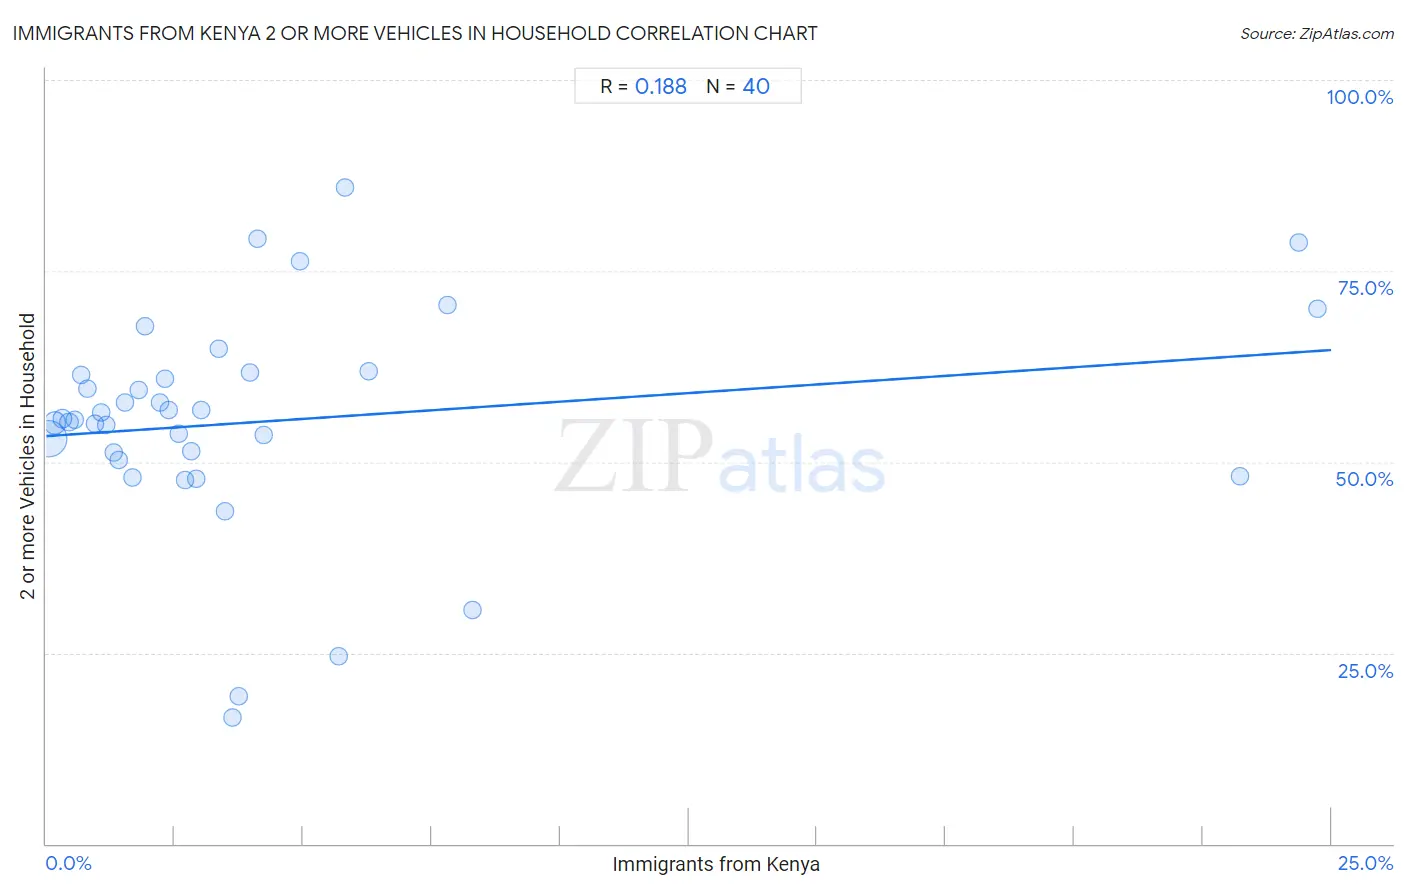
Immigrants from Kenya 2 or more Vehicles in Household Correlation Chart

The statistical analysis conducted on geographies consisting of 218,001,481 people shows a poor positive correlation between the proportion of Immigrants from Kenya and percentage of households with 2 or more vehicles available in the United States with a correlation coefficient (R) of 0.188 and weighted average of 55.1%. On average, for every 1% (one percent) increase in Immigrants from Kenya within a typical geography, there is an increase of 0.45% in percentage of households with 2 or more vehicles available.
Immigrants from Kenya 2 or more Vehicles in Household
It is essential to understand that the correlation between the percentage of Immigrants from Kenya and percentage of households with 2 or more vehicles available does not imply a direct cause-and-effect relationship. It remains uncertain whether the presence of Immigrants from Kenya influences an upward or downward trend in the level of percentage of households with 2 or more vehicles available within an area, or if Immigrants from Kenya simply ended up residing in those areas with higher or lower levels of percentage of households with 2 or more vehicles available due to other factors.

Demographics Similar to Immigrants from Kenya by 2 or more Vehicles in Household

In terms of 2 or more vehicles in household, the demographic groups most similar to Immigrants from Kenya are Immigrants from Micronesia (55.1%, a difference of 0.090%), Cree (55.1%, a difference of 0.090%), Alaskan Athabascan (55.2%, a difference of 0.11%), Immigrants from Cameroon (55.1%, a difference of 0.13%), and Apache (55.1%, a difference of 0.15%).
DemographicsRating | Rank2 or more Vehicles in Household
Immigrants from Western Europe
51.4
/100
|
#173
Average
55.4%
Navajo
50.0
/100
|
#174
Average
55.3%
Immigrants from Denmark
49.4
/100
|
#175
Average
55.3%
Immigrants from Cuba
47.0
/100
|
#176
Average
55.3%
Menominee
46.2
/100
|
#177
Average
55.3%
Immigrants from Sweden
45.3
/100
|
#178
Average
55.2%
Alaskan Athabascans
42.9
/100
|
#179
Average
55.2%
Immigrants from Kenya
40.4
/100
|
#180
Average
55.1%
Immigrants from Micronesia
38.2
/100
|
#181
Fair
55.1%
Cree
38.2
/100
|
#182
Fair
55.1%
Immigrants from Cameroon
37.3
/100
|
#183
Fair
55.1%
Apache
36.7
/100
|
#184
Fair
55.1%
Arabs
35.9
/100
|
#185
Fair
55.0%
Peruvians
33.7
/100
|
#186
Fair
55.0%
Immigrants from Uganda
33.4
/100
|
#187
Fair
55.0%

Immigrants from Kenya 2 or more Vehicles in Household Correlation Summary

MeasurementImmigrants from Kenya Data2 or more Vehicles in Household Data
Minimum0.045%16.4%
Maximum24.7%85.9%
Range24.7%69.4%
Mean4.4%55.3%
Median2.6%55.6%
Interquartile 25% (IQ1)1.2%50.7%
Interquartile 75% (IQ3)4.2%61.6%
Interquartile Range (IQR)2.9%10.9%
Standard Deviation (Sample)6.0%14.5%
Standard Deviation (Population)6.0%14.3%

Correlation Details

Immigrants from Kenya PercentileSample Size2 or more Vehicles in Household
[
0.0%
-
0.5%
]
0.045%
154,703,36853.0%
[
0.0%
-
0.5%
]
0.17%
33,132,73955.1%
[
0.0%
-
0.5%
]
0.31%
12,122,02055.7%
[
0.0%
-
0.5%
]
0.44%
6,459,99255.2%
[
0.5%
-
1.0%
]
0.56%
3,977,98255.5%
[
0.5%
-
1.0%
]
0.67%
1,896,14261.4%
[
0.5%
-
1.0%
]
0.79%
1,466,09759.6%
[
0.5%
-
1.0%
]
0.94%
979,32755.0%
[
1.0%
-
1.5%
]
1.06%
825,39056.5%
[
1.0%
-
1.5%
]
1.16%
572,15154.8%
[
1.0%
-
1.5%
]
1.30%
387,44851.2%
[
1.0%
-
1.5%
]
1.42%
305,22750.2%
[
1.5%
-
2.0%
]
1.53%
261,89957.8%
[
1.5%
-
2.0%
]
1.68%
111,33148.0%
[
1.5%
-
2.0%
]
1.79%
229,90459.3%
[
1.5%
-
2.0%
]
1.92%
113,72067.7%
[
2.0%
-
2.5%
]
2.20%
191,12057.7%
[
2.0%
-
2.5%
]
2.30%
9,17160.8%
[
2.0%
-
2.5%
]
2.39%
55,33256.7%
[
2.5%
-
3.0%
]
2.58%
27,29053.7%
[
2.5%
-
3.0%
]
2.70%
16,08647.6%
[
2.5%
-
3.0%
]
2.82%
61,57851.4%
[
2.5%
-
3.0%
]
2.93%
16,88447.8%
[
3.0%
-
3.5%
]
3.02%
16,94756.7%
[
3.0%
-
3.5%
]
3.36%
2,61864.8%
[
3.0%
-
3.5%
]
3.48%
2,15443.6%
[
3.5%
-
4.0%
]
3.62%
8,89216.4%
[
3.5%
-
4.0%
]
3.74%
10,81119.3%
[
3.5%
-
4.0%
]
3.96%
22761.8%
[
4.0%
-
4.5%
]
4.10%
2,46479.3%
[
4.0%
-
4.5%
]
4.23%
24,00853.6%
[
4.5%
-
5.0%
]
4.94%
32476.3%
[
5.5%
-
6.0%
]
5.68%
3,83824.6%
[
5.5%
-
6.0%
]
5.82%
3,21485.9%
[
6.0%
-
6.5%
]
6.27%
1,40361.8%
[
7.5%
-
8.0%
]
7.80%
42370.6%
[
8.0%
-
8.5%
]
8.30%
1,15730.6%
[
23.0%
-
23.5%
]
23.22%
26748.1%
[
24.0%
-
24.5%
]
24.37%
43978.8%
[
24.5%
-
25.0%
]
24.74%
9770.0%