Immigrants from Kenya 3 or more Vehicles in Household
COMPARE
Immigrants from Kenya
Select to Compare
3 or more Vehicles in Household
Immigrants from Kenya 3 or more Vehicles in Household
18.8%
3+ VEHICLES AVAILABLE
12.4/ 100
METRIC RATING
211th/ 347
METRIC RANK
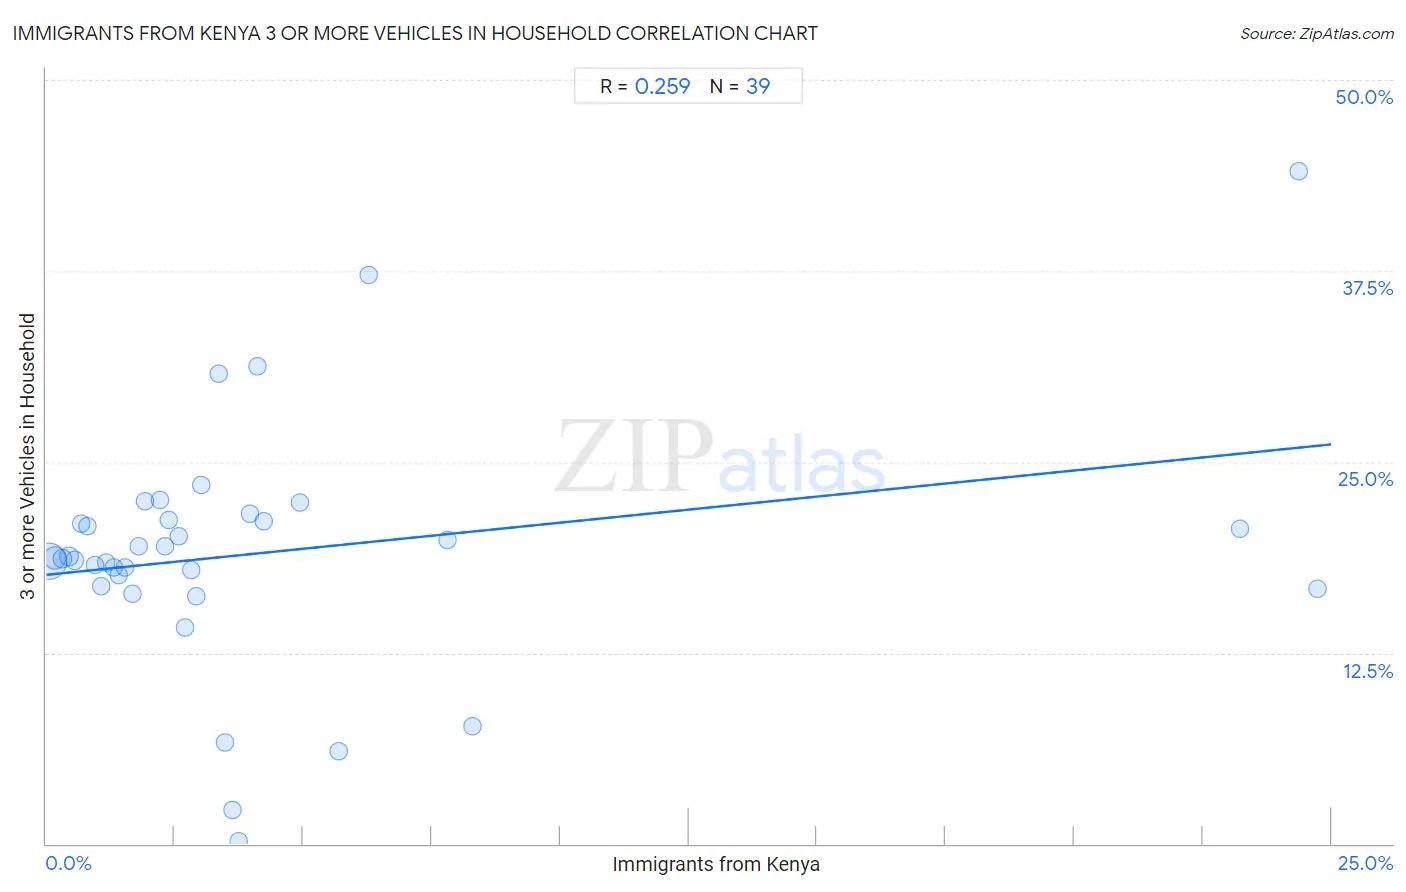
Immigrants from Kenya 3 or more Vehicles in Household Correlation Chart
The statistical analysis conducted on geographies consisting of 217,959,739 people shows a weak positive correlation between the proportion of Immigrants from Kenya and percentage of households with 3 or more vehicles available in the United States with a correlation coefficient (R) of 0.259 and weighted average of 18.8%. On average, for every 1% (one percent) increase in Immigrants from Kenya within a typical geography, there is an increase of 0.34% in percentage of households with 3 or more vehicles available.
It is essential to understand that the correlation between the percentage of Immigrants from Kenya and percentage of households with 3 or more vehicles available does not imply a direct cause-and-effect relationship. It remains uncertain whether the presence of Immigrants from Kenya influences an upward or downward trend in the level of percentage of households with 3 or more vehicles available within an area, or if Immigrants from Kenya simply ended up residing in those areas with higher or lower levels of percentage of households with 3 or more vehicles available due to other factors.
Demographics Similar to Immigrants from Kenya by 3 or more Vehicles in Household
In terms of 3 or more vehicles in household, the demographic groups most similar to Immigrants from Kenya are Bulgarian (18.8%, a difference of 0.12%), Panamanian (18.8%, a difference of 0.14%), Immigrants from Cuba (18.8%, a difference of 0.15%), Immigrants from Egypt (18.8%, a difference of 0.20%), and Immigrants from Chile (18.8%, a difference of 0.21%).
| Demographics | Rating | Rank | 3 or more Vehicles in Household |
| Immigrants from Romania | 14.6 /100 | #204 | Poor 18.9% |
| Russians | 14.2 /100 | #205 | Poor 18.8% |
| Immigrants from Eastern Asia | 14.1 /100 | #206 | Poor 18.8% |
| Immigrants from Chile | 13.6 /100 | #207 | Poor 18.8% |
| Immigrants from Burma/Myanmar | 13.6 /100 | #208 | Poor 18.8% |
| Immigrants from Egypt | 13.5 /100 | #209 | Poor 18.8% |
| Bulgarians | 13.1 /100 | #210 | Poor 18.8% |
| Immigrants from Kenya | 12.4 /100 | #211 | Poor 18.8% |
| Panamanians | 11.6 /100 | #212 | Poor 18.8% |
| Immigrants from Cuba | 11.6 /100 | #213 | Poor 18.8% |
| Immigrants from Sierra Leone | 10.8 /100 | #214 | Poor 18.7% |
| Eastern Europeans | 10.6 /100 | #215 | Poor 18.7% |
| Immigrants from Nigeria | 10.3 /100 | #216 | Poor 18.7% |
| Immigrants from Italy | 10.2 /100 | #217 | Poor 18.7% |
| Immigrants from Portugal | 8.9 /100 | #218 | Tragic 18.6% |
Immigrants from Kenya 3 or more Vehicles in Household Correlation Summary
| Measurement | Immigrants from Kenya Data | 3 or more Vehicles in Household Data |
| Minimum | 0.045% | 0.19% |
| Maximum | 24.7% | 44.0% |
| Range | 24.7% | 43.8% |
| Mean | 4.3% | 19.1% |
| Median | 2.6% | 18.7% |
| Interquartile 25% (IQ1) | 1.2% | 16.9% |
| Interquartile 75% (IQ3) | 4.1% | 21.2% |
| Interquartile Range (IQR) | 2.9% | 4.3% |
| Standard Deviation (Sample) | 6.1% | 8.1% |
| Standard Deviation (Population) | 6.0% | 8.0% |
Correlation Details
| Immigrants from Kenya Percentile | Sample Size | 3 or more Vehicles in Household |
[ 0.0% - 0.5% ] 0.045% | 154,689,585 | 18.5% |
[ 0.0% - 0.5% ] 0.17% | 33,125,042 | 18.7% |
[ 0.0% - 0.5% ] 0.31% | 12,108,938 | 18.6% |
[ 0.0% - 0.5% ] 0.44% | 6,459,992 | 18.8% |
[ 0.5% - 1.0% ] 0.56% | 3,977,982 | 18.5% |
[ 0.5% - 1.0% ] 0.67% | 1,896,142 | 21.0% |
[ 0.5% - 1.0% ] 0.79% | 1,466,097 | 20.8% |
[ 0.5% - 1.0% ] 0.94% | 979,327 | 18.3% |
[ 1.0% - 1.5% ] 1.06% | 825,390 | 16.9% |
[ 1.0% - 1.5% ] 1.16% | 572,151 | 18.4% |
[ 1.0% - 1.5% ] 1.30% | 387,448 | 18.1% |
[ 1.0% - 1.5% ] 1.42% | 301,261 | 17.6% |
[ 1.5% - 2.0% ] 1.53% | 261,899 | 18.1% |
[ 1.5% - 2.0% ] 1.68% | 111,331 | 16.4% |
[ 1.5% - 2.0% ] 1.79% | 229,904 | 19.5% |
[ 1.5% - 2.0% ] 1.92% | 113,720 | 22.4% |
[ 2.0% - 2.5% ] 2.20% | 191,120 | 22.5% |
[ 2.0% - 2.5% ] 2.30% | 9,171 | 19.5% |
[ 2.0% - 2.5% ] 2.39% | 55,332 | 21.2% |
[ 2.5% - 3.0% ] 2.58% | 27,290 | 20.1% |
[ 2.5% - 3.0% ] 2.70% | 16,086 | 14.2% |
[ 2.5% - 3.0% ] 2.82% | 61,578 | 18.0% |
[ 2.5% - 3.0% ] 2.93% | 16,884 | 16.2% |
[ 3.0% - 3.5% ] 3.02% | 16,947 | 23.5% |
[ 3.0% - 3.5% ] 3.36% | 2,618 | 30.8% |
[ 3.0% - 3.5% ] 3.48% | 2,154 | 6.6% |
[ 3.5% - 4.0% ] 3.62% | 8,892 | 2.2% |
[ 3.5% - 4.0% ] 3.74% | 10,811 | 0.19% |
[ 3.5% - 4.0% ] 3.96% | 227 | 21.6% |
[ 4.0% - 4.5% ] 4.10% | 2,464 | 31.2% |
[ 4.0% - 4.5% ] 4.23% | 24,008 | 21.1% |
[ 4.5% - 5.0% ] 4.94% | 324 | 22.4% |
[ 5.5% - 6.0% ] 5.68% | 3,838 | 6.1% |
[ 6.0% - 6.5% ] 6.27% | 1,403 | 37.2% |
[ 7.5% - 8.0% ] 7.80% | 423 | 19.9% |
[ 8.0% - 8.5% ] 8.30% | 1,157 | 7.7% |
[ 23.0% - 23.5% ] 23.22% | 267 | 20.6% |
[ 24.0% - 24.5% ] 24.37% | 439 | 44.0% |
[ 24.5% - 25.0% ] 24.74% | 97 | 16.7% |