Immigrants from Kenya Married-Couple Family Poverty

COMPARE

Immigrants from Kenya
Race
Ancestry
AfghanAfricanAlaska NativeAlaskan AthabascanAlbanianAleutAlsatianAmericanApacheArabArapahoArgentineanArmenianAssyrian/Chaldean/SyriacAustralianAustrianBahamianBangladeshiBarbadianBasqueBelgianBelizeanBermudanBhutaneseBlackfeetBolivianBrazilianBritishBritish West IndianBulgarianBurmeseCajunCambodianCanadianCape VerdeanCarpatho RusynCelticCentral AmericanCentral American IndianCherokeeCheyenneChickasawChileanChineseChippewaChoctawColombianColvilleComancheCosta RicanCreeCreekCroatianCrowCubanCypriotCzechCzechoslovakianDanishDelawareDominicanDutchDutch West IndianEastern EuropeanEcuadorianEgyptianEnglishEstonianEthiopianEuropeanFijianFilipinoFinnishFrenchFrench American IndianFrench CanadianGermanGerman RussianGhanaianGreekGuamanian/ChamorroGuatemalanGuyaneseHaitianHmongHonduranHopiHoumaHungarianIcelanderIndian (Asian)IndonesianInupiatIranianIraqiIrishIroquoisIsraeliItalianJamaicanJapaneseJordanianKenyanKiowaKoreanLaotianLatvianLebaneseLiberianLithuanianLumbeeLuxembourgerMacedonianMalaysianMalteseMarshalleseMenomineeMexicanMexican American IndianMongolianMoroccanNative HawaiianNavajoNepaleseNew ZealanderNicaraguanNigerianNorthern EuropeanNorwegianOkinawanOsageOttawaPaiutePakistaniPalestinianPanamanianParaguayanPennsylvania GermanPeruvianPimaPolishPortuguesePotawatomiPuebloPuerto RicanPuget Sound SalishRomanianRussianSalvadoranSamoanScandinavianScotch-IrishScottishSeminoleSenegaleseSerbianShoshoneSierra LeoneanSiouxSlavicSlovakSloveneSomaliSouth AfricanSouth AmericanSouth American IndianSoviet UnionSpaniardSpanishSpanish AmericanSpanish American IndianSri LankanSubsaharan AfricanSudaneseSwedishSwissSyrianTaiwaneseThaiTlingit-HaidaTohono O'OdhamTonganTrinidadian and TobagonianTsimshianTurkishU.S. Virgin IslanderUgandanUkrainianUruguayanUteVenezuelanVietnameseWelshWest IndianYakamaYaquiYugoslavianYumanYup'ikZimbabwean
Immigration
NonimmigrantsImmigrantsAfghanistanAfricaAlbaniaArgentinaArmeniaAsiaAustraliaAustriaBahamasBangladeshBarbadosBelarusBelgiumBelizeBoliviaBosnia and HerzegovinaBrazilBulgariaBurma/MyanmarCabo VerdeCambodiaCameroonCanadaCaribbeanCentral AmericaChileChinaColombiaCongoCosta RicaCroatiaCubaCzechoslovakiaDenmarkDominicaDominican RepublicEastern AfricaEastern AsiaEastern EuropeEcuadorEgyptEl SalvadorEnglandEritreaEthiopiaEuropeFijiFranceGermanyGhanaGreeceGrenadaGuatemalaGuyanaHaitiHondurasHong KongHungaryIndiaIndonesiaIranIraqIrelandIsraelItalyJamaicaJapanJordanKazakhstanKenyaKoreaKuwaitLaosLatin AmericaLatviaLebanonLiberiaLithuaniaMalaysiaMexicoMicronesiaMiddle AfricaMoldovaMoroccoNepalNetherlandsNicaraguaNigeriaNorth AmericaNorth MacedoniaNorthern AfricaNorthern EuropeNorwayOceaniaPakistanPanamaPeruPhilippinesPolandPortugalRomaniaRussiaSaudi ArabiaScotlandSenegalSerbiaSierra LeoneSingaporeSomaliaSouth AfricaSouth AmericaSouth Central AsiaSouth Eastern AsiaSouthern EuropeSpainSri LankaSt. Vincent and the GrenadinesSudanSwedenSwitzerlandSyriaTaiwanThailandTrinidad and TobagoTurkeyUgandaUkraineUruguayUzbekistanVenezuelaVietnamWest IndiesWestern AfricaWestern AsiaWestern EuropeYemenZaireZimbabweAzores
Select to Compare
Race
Ancestry
AfghanAfricanAlaska NativeAlaskan AthabascanAlbanianAleutAlsatianAmericanApacheArabArapahoArgentineanArmenianAssyrian/Chaldean/SyriacAustralianAustrianBahamianBangladeshiBarbadianBasqueBelgianBelizeanBermudanBhutaneseBlackfeetBolivianBrazilianBritishBritish West IndianBulgarianBurmeseCajunCambodianCanadianCape VerdeanCarpatho RusynCelticCentral AmericanCentral American IndianCherokeeCheyenneChickasawChileanChineseChippewaChoctawColombianColvilleComancheCosta RicanCreeCreekCroatianCrowCubanCypriotCzechCzechoslovakianDanishDelawareDominicanDutchDutch West IndianEastern EuropeanEcuadorianEgyptianEnglishEstonianEthiopianEuropeanFijianFilipinoFinnishFrenchFrench American IndianFrench CanadianGermanGerman RussianGhanaianGreekGuamanian/ChamorroGuatemalanGuyaneseHaitianHmongHonduranHopiHoumaHungarianIcelanderIndian (Asian)IndonesianInupiatIranianIraqiIrishIroquoisIsraeliItalianJamaicanJapaneseJordanianKenyanKiowaKoreanLaotianLatvianLebaneseLiberianLithuanianLumbeeLuxembourgerMacedonianMalaysianMalteseMarshalleseMenomineeMexicanMexican American IndianMongolianMoroccanNative HawaiianNavajoNepaleseNew ZealanderNicaraguanNigerianNorthern EuropeanNorwegianOkinawanOsageOttawaPaiutePakistaniPalestinianPanamanianParaguayanPennsylvania GermanPeruvianPimaPolishPortuguesePotawatomiPuebloPuerto RicanPuget Sound SalishRomanianRussianSalvadoranSamoanScandinavianScotch-IrishScottishSeminoleSenegaleseSerbianShoshoneSierra LeoneanSiouxSlavicSlovakSloveneSomaliSouth AfricanSouth AmericanSouth American IndianSoviet UnionSpaniardSpanishSpanish AmericanSpanish American IndianSri LankanSubsaharan AfricanSudaneseSwedishSwissSyrianTaiwaneseThaiTlingit-HaidaTohono O'OdhamTonganTrinidadian and TobagonianTsimshianTurkishU.S. Virgin IslanderUgandanUkrainianUruguayanUteVenezuelanVietnameseWelshWest IndianYakamaYaquiYugoslavianYumanYup'ikZimbabwean
Immigration
NonimmigrantsImmigrantsAfghanistanAfricaAlbaniaArgentinaArmeniaAsiaAustraliaAustriaBahamasBangladeshBarbadosBelarusBelgiumBelizeBoliviaBosnia and HerzegovinaBrazilBulgariaBurma/MyanmarCabo VerdeCambodiaCameroonCanadaCaribbeanCentral AmericaChileChinaColombiaCongoCosta RicaCroatiaCubaCzechoslovakiaDenmarkDominicaDominican RepublicEastern AfricaEastern AsiaEastern EuropeEcuadorEgyptEl SalvadorEnglandEritreaEthiopiaEuropeFijiFranceGermanyGhanaGreeceGrenadaGuatemalaGuyanaHaitiHondurasHong KongHungaryIndiaIndonesiaIranIraqIrelandIsraelItalyJamaicaJapanJordanKazakhstanKoreaKuwaitLaosLatin AmericaLatviaLebanonLiberiaLithuaniaMalaysiaMexicoMicronesiaMiddle AfricaMoldovaMoroccoNepalNetherlandsNicaraguaNigeriaNorth AmericaNorth MacedoniaNorthern AfricaNorthern EuropeNorwayOceaniaPakistanPanamaPeruPhilippinesPolandPortugalRomaniaRussiaSaudi ArabiaScotlandSenegalSerbiaSierra LeoneSingaporeSomaliaSouth AfricaSouth AmericaSouth Central AsiaSouth Eastern AsiaSouthern EuropeSpainSri LankaSt. Vincent and the GrenadinesSudanSwedenSwitzerlandSyriaTaiwanThailandTrinidad and TobagoTurkeyUgandaUkraineUruguayUzbekistanVenezuelaVietnamWest IndiesWestern AfricaWestern AsiaWestern EuropeYemenZaireZimbabweAzores
Married-Couple Family Poverty
Income
Poverty
Unemployment
Labor Participation
Family Structure
Vehicle Availability
Education Level
Disability

Immigrants from Kenya Married-Couple Family Poverty
Exceptional

4.9%
POVERTY | MARRIED-COUPLE FAMILIES
90.2/ 100
METRIC RATING
133rd/ 347
METRIC RANK

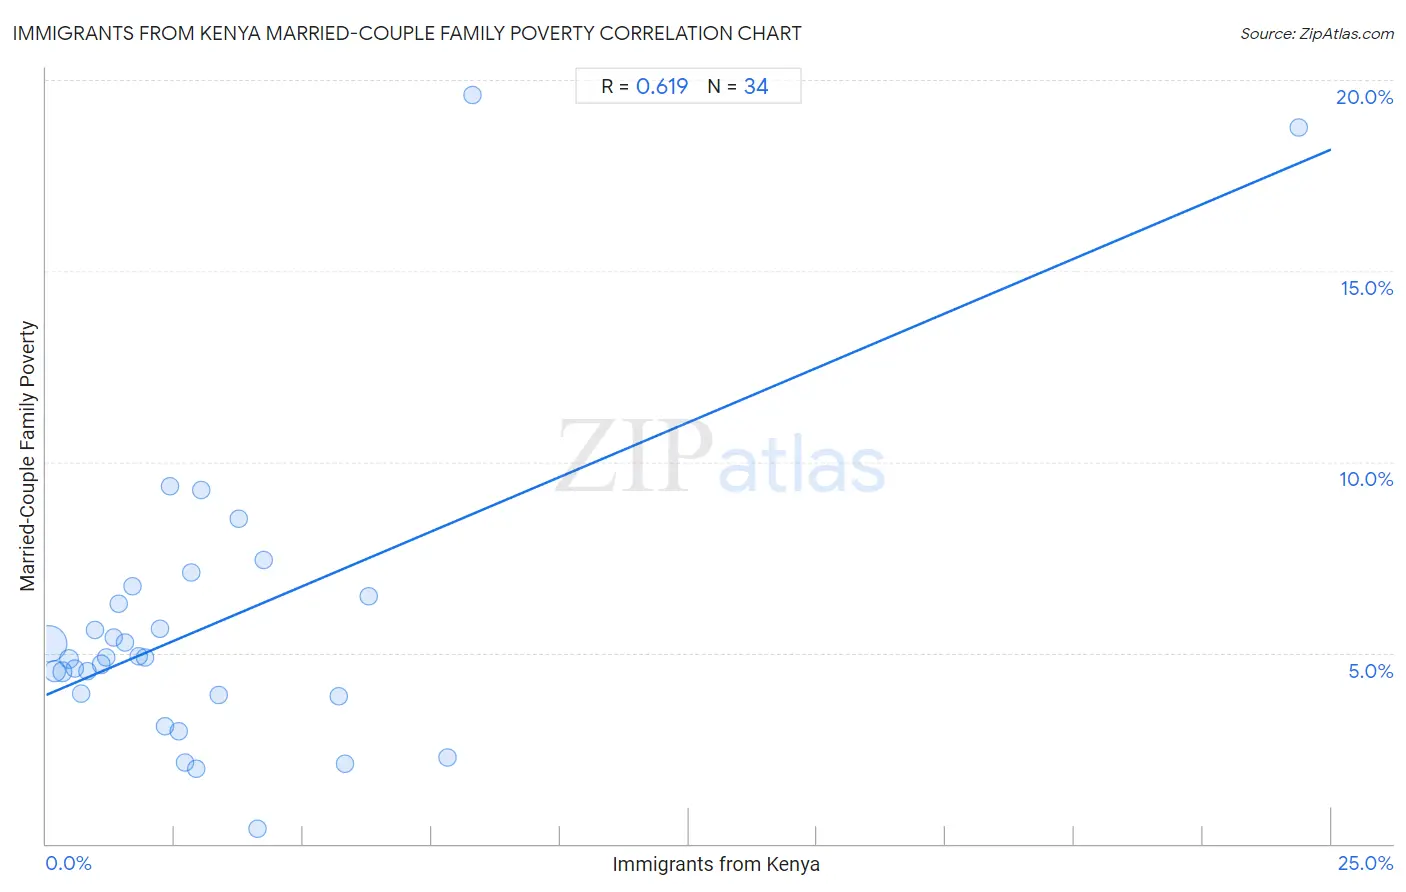
Immigrants from Kenya Married-Couple Family Poverty Correlation Chart

The statistical analysis conducted on geographies consisting of 217,162,212 people shows a significant positive correlation between the proportion of Immigrants from Kenya and poverty level among married-couple families in the United States with a correlation coefficient (R) of 0.619 and weighted average of 4.9%. On average, for every 1% (one percent) increase in Immigrants from Kenya within a typical geography, there is an increase of 0.57% in poverty level among married-couple families.
Immigrants from Kenya Married-Couple Family Poverty
It is essential to understand that the correlation between the percentage of Immigrants from Kenya and poverty level among married-couple families does not imply a direct cause-and-effect relationship. It remains uncertain whether the presence of Immigrants from Kenya influences an upward or downward trend in the level of poverty level among married-couple families within an area, or if Immigrants from Kenya simply ended up residing in those areas with higher or lower levels of poverty level among married-couple families due to other factors.

Demographics Similar to Immigrants from Kenya by Married-Couple Family Poverty

In terms of married-couple family poverty, the demographic groups most similar to Immigrants from Kenya are Samoan (4.9%, a difference of 0.010%), Puget Sound Salish (4.9%, a difference of 0.070%), Immigrants from Eastern Europe (4.9%, a difference of 0.090%), Soviet Union (4.9%, a difference of 0.15%), and Immigrants from Pakistan (4.9%, a difference of 0.16%).
DemographicsRating | RankMarried-Couple Family Poverty
Immigrants from Asia
92.3
/100
|
#126
Exceptional
4.8%
Egyptians
92.0
/100
|
#127
Exceptional
4.8%
Palestinians
91.2
/100
|
#128
Exceptional
4.9%
Immigrants from Pakistan
90.7
/100
|
#129
Exceptional
4.9%
Soviet Union
90.7
/100
|
#130
Exceptional
4.9%
Immigrants from Eastern Europe
90.5
/100
|
#131
Exceptional
4.9%
Puget Sound Salish
90.4
/100
|
#132
Exceptional
4.9%
Immigrants from Kenya
90.2
/100
|
#133
Exceptional
4.9%
Samoans
90.2
/100
|
#134
Exceptional
4.9%
Assyrians/Chaldeans/Syriacs
89.4
/100
|
#135
Excellent
4.9%
Immigrants from Hungary
88.7
/100
|
#136
Excellent
4.9%
Guamanians/Chamorros
86.5
/100
|
#137
Excellent
4.9%
Chileans
86.0
/100
|
#138
Excellent
4.9%
German Russians
85.1
/100
|
#139
Excellent
5.0%
Immigrants from Portugal
84.8
/100
|
#140
Excellent
5.0%

Immigrants from Kenya Married-Couple Family Poverty Correlation Summary

MeasurementImmigrants from Kenya DataMarried-Couple Family Poverty Data
Minimum0.045%0.40%
Maximum24.4%19.6%
Range24.3%19.2%
Mean3.2%5.8%
Median2.3%4.9%
Interquartile 25% (IQ1)1.1%3.9%
Interquartile 75% (IQ3)3.7%6.5%
Interquartile Range (IQR)2.7%2.6%
Standard Deviation (Sample)4.3%4.0%
Standard Deviation (Population)4.2%3.9%

Correlation Details

Immigrants from Kenya PercentileSample SizeMarried-Couple Family Poverty
[
0.0%
-
0.5%
]
0.045%
154,503,1925.3%
[
0.0%
-
0.5%
]
0.17%
32,950,4594.5%
[
0.0%
-
0.5%
]
0.31%
12,014,3084.5%
[
0.0%
-
0.5%
]
0.44%
6,385,2624.8%
[
0.5%
-
1.0%
]
0.56%
3,881,2114.6%
[
0.5%
-
1.0%
]
0.67%
1,878,9313.9%
[
0.5%
-
1.0%
]
0.79%
1,417,2734.5%
[
0.5%
-
1.0%
]
0.94%
957,0945.6%
[
1.0%
-
1.5%
]
1.06%
817,8104.7%
[
1.0%
-
1.5%
]
1.16%
565,1564.9%
[
1.0%
-
1.5%
]
1.30%
384,6135.4%
[
1.0%
-
1.5%
]
1.42%
305,2276.3%
[
1.5%
-
2.0%
]
1.53%
258,1795.3%
[
1.5%
-
2.0%
]
1.68%
100,3766.8%
[
1.5%
-
2.0%
]
1.80%
209,1784.9%
[
1.5%
-
2.0%
]
1.92%
112,8684.9%
[
2.0%
-
2.5%
]
2.20%
189,8845.6%
[
2.0%
-
2.5%
]
2.31%
6,7063.1%
[
2.0%
-
2.5%
]
2.41%
37,6559.4%
[
2.5%
-
3.0%
]
2.58%
27,2903.0%
[
2.5%
-
3.0%
]
2.70%
16,0862.1%
[
2.5%
-
3.0%
]
2.82%
61,1747.1%
[
2.5%
-
3.0%
]
2.93%
16,8842.0%
[
3.0%
-
3.5%
]
3.02%
15,0219.2%
[
3.0%
-
3.5%
]
3.36%
2,6183.9%
[
3.5%
-
4.0%
]
3.74%
10,8118.5%
[
4.0%
-
4.5%
]
4.10%
2,4640.40%
[
4.0%
-
4.5%
]
4.23%
24,0087.4%
[
5.5%
-
6.0%
]
5.68%
3,8383.9%
[
5.5%
-
6.0%
]
5.82%
3,2142.1%
[
6.0%
-
6.5%
]
6.27%
1,4036.5%
[
7.5%
-
8.0%
]
7.80%
4232.3%
[
8.0%
-
8.5%
]
8.30%
1,15719.6%
[
24.0%
-
24.5%
]
24.37%
43918.8%