Immigrants from Kenya 1 or more Vehicles in Household

COMPARE

Immigrants from Kenya
Race
Ancestry
AfghanAfricanAlaska NativeAlaskan AthabascanAlbanianAleutAlsatianAmericanApacheArabArapahoArgentineanArmenianAssyrian/Chaldean/SyriacAustralianAustrianBahamianBangladeshiBarbadianBasqueBelgianBelizeanBermudanBhutaneseBlackfeetBolivianBrazilianBritishBritish West IndianBulgarianBurmeseCajunCambodianCanadianCape VerdeanCarpatho RusynCelticCentral AmericanCentral American IndianCherokeeCheyenneChickasawChileanChineseChippewaChoctawColombianColvilleComancheCosta RicanCreeCreekCroatianCrowCubanCypriotCzechCzechoslovakianDanishDelawareDominicanDutchDutch West IndianEastern EuropeanEcuadorianEgyptianEnglishEstonianEthiopianEuropeanFijianFilipinoFinnishFrenchFrench American IndianFrench CanadianGermanGerman RussianGhanaianGreekGuamanian/ChamorroGuatemalanGuyaneseHaitianHmongHonduranHopiHoumaHungarianIcelanderIndian (Asian)IndonesianInupiatIranianIraqiIrishIroquoisIsraeliItalianJamaicanJapaneseJordanianKenyanKiowaKoreanLaotianLatvianLebaneseLiberianLithuanianLumbeeLuxembourgerMacedonianMalaysianMalteseMarshalleseMenomineeMexicanMexican American IndianMongolianMoroccanNative HawaiianNavajoNepaleseNew ZealanderNicaraguanNigerianNorthern EuropeanNorwegianOkinawanOsageOttawaPaiutePakistaniPalestinianPanamanianParaguayanPennsylvania GermanPeruvianPimaPolishPortuguesePotawatomiPuebloPuerto RicanPuget Sound SalishRomanianRussianSalvadoranSamoanScandinavianScotch-IrishScottishSeminoleSenegaleseSerbianShoshoneSierra LeoneanSiouxSlavicSlovakSloveneSomaliSouth AfricanSouth AmericanSouth American IndianSoviet UnionSpaniardSpanishSpanish AmericanSpanish American IndianSri LankanSubsaharan AfricanSudaneseSwedishSwissSyrianTaiwaneseThaiTlingit-HaidaTohono O'OdhamTonganTrinidadian and TobagonianTsimshianTurkishU.S. Virgin IslanderUgandanUkrainianUruguayanUteVenezuelanVietnameseWelshWest IndianYakamaYaquiYugoslavianYumanYup'ikZimbabwean
Immigration
NonimmigrantsImmigrantsAfghanistanAfricaAlbaniaArgentinaArmeniaAsiaAustraliaAustriaBahamasBangladeshBarbadosBelarusBelgiumBelizeBoliviaBosnia and HerzegovinaBrazilBulgariaBurma/MyanmarCabo VerdeCambodiaCameroonCanadaCaribbeanCentral AmericaChileChinaColombiaCongoCosta RicaCroatiaCubaCzechoslovakiaDenmarkDominicaDominican RepublicEastern AfricaEastern AsiaEastern EuropeEcuadorEgyptEl SalvadorEnglandEritreaEthiopiaEuropeFijiFranceGermanyGhanaGreeceGrenadaGuatemalaGuyanaHaitiHondurasHong KongHungaryIndiaIndonesiaIranIraqIrelandIsraelItalyJamaicaJapanJordanKazakhstanKenyaKoreaKuwaitLaosLatin AmericaLatviaLebanonLiberiaLithuaniaMalaysiaMexicoMicronesiaMiddle AfricaMoldovaMoroccoNepalNetherlandsNicaraguaNigeriaNorth AmericaNorth MacedoniaNorthern AfricaNorthern EuropeNorwayOceaniaPakistanPanamaPeruPhilippinesPolandPortugalRomaniaRussiaSaudi ArabiaScotlandSenegalSerbiaSierra LeoneSingaporeSomaliaSouth AfricaSouth AmericaSouth Central AsiaSouth Eastern AsiaSouthern EuropeSpainSri LankaSt. Vincent and the GrenadinesSudanSwedenSwitzerlandSyriaTaiwanThailandTrinidad and TobagoTurkeyUgandaUkraineUruguayUzbekistanVenezuelaVietnamWest IndiesWestern AfricaWestern AsiaWestern EuropeYemenZaireZimbabweAzores
Select to Compare
Race
Ancestry
AfghanAfricanAlaska NativeAlaskan AthabascanAlbanianAleutAlsatianAmericanApacheArabArapahoArgentineanArmenianAssyrian/Chaldean/SyriacAustralianAustrianBahamianBangladeshiBarbadianBasqueBelgianBelizeanBermudanBhutaneseBlackfeetBolivianBrazilianBritishBritish West IndianBulgarianBurmeseCajunCambodianCanadianCape VerdeanCarpatho RusynCelticCentral AmericanCentral American IndianCherokeeCheyenneChickasawChileanChineseChippewaChoctawColombianColvilleComancheCosta RicanCreeCreekCroatianCrowCubanCypriotCzechCzechoslovakianDanishDelawareDominicanDutchDutch West IndianEastern EuropeanEcuadorianEgyptianEnglishEstonianEthiopianEuropeanFijianFilipinoFinnishFrenchFrench American IndianFrench CanadianGermanGerman RussianGhanaianGreekGuamanian/ChamorroGuatemalanGuyaneseHaitianHmongHonduranHopiHoumaHungarianIcelanderIndian (Asian)IndonesianInupiatIranianIraqiIrishIroquoisIsraeliItalianJamaicanJapaneseJordanianKenyanKiowaKoreanLaotianLatvianLebaneseLiberianLithuanianLumbeeLuxembourgerMacedonianMalaysianMalteseMarshalleseMenomineeMexicanMexican American IndianMongolianMoroccanNative HawaiianNavajoNepaleseNew ZealanderNicaraguanNigerianNorthern EuropeanNorwegianOkinawanOsageOttawaPaiutePakistaniPalestinianPanamanianParaguayanPennsylvania GermanPeruvianPimaPolishPortuguesePotawatomiPuebloPuerto RicanPuget Sound SalishRomanianRussianSalvadoranSamoanScandinavianScotch-IrishScottishSeminoleSenegaleseSerbianShoshoneSierra LeoneanSiouxSlavicSlovakSloveneSomaliSouth AfricanSouth AmericanSouth American IndianSoviet UnionSpaniardSpanishSpanish AmericanSpanish American IndianSri LankanSubsaharan AfricanSudaneseSwedishSwissSyrianTaiwaneseThaiTlingit-HaidaTohono O'OdhamTonganTrinidadian and TobagonianTsimshianTurkishU.S. Virgin IslanderUgandanUkrainianUruguayanUteVenezuelanVietnameseWelshWest IndianYakamaYaquiYugoslavianYumanYup'ikZimbabwean
Immigration
NonimmigrantsImmigrantsAfghanistanAfricaAlbaniaArgentinaArmeniaAsiaAustraliaAustriaBahamasBangladeshBarbadosBelarusBelgiumBelizeBoliviaBosnia and HerzegovinaBrazilBulgariaBurma/MyanmarCabo VerdeCambodiaCameroonCanadaCaribbeanCentral AmericaChileChinaColombiaCongoCosta RicaCroatiaCubaCzechoslovakiaDenmarkDominicaDominican RepublicEastern AfricaEastern AsiaEastern EuropeEcuadorEgyptEl SalvadorEnglandEritreaEthiopiaEuropeFijiFranceGermanyGhanaGreeceGrenadaGuatemalaGuyanaHaitiHondurasHong KongHungaryIndiaIndonesiaIranIraqIrelandIsraelItalyJamaicaJapanJordanKazakhstanKoreaKuwaitLaosLatin AmericaLatviaLebanonLiberiaLithuaniaMalaysiaMexicoMicronesiaMiddle AfricaMoldovaMoroccoNepalNetherlandsNicaraguaNigeriaNorth AmericaNorth MacedoniaNorthern AfricaNorthern EuropeNorwayOceaniaPakistanPanamaPeruPhilippinesPolandPortugalRomaniaRussiaSaudi ArabiaScotlandSenegalSerbiaSierra LeoneSingaporeSomaliaSouth AfricaSouth AmericaSouth Central AsiaSouth Eastern AsiaSouthern EuropeSpainSri LankaSt. Vincent and the GrenadinesSudanSwedenSwitzerlandSyriaTaiwanThailandTrinidad and TobagoTurkeyUgandaUkraineUruguayUzbekistanVenezuelaVietnamWest IndiesWestern AfricaWestern AsiaWestern EuropeYemenZaireZimbabweAzores
1 or more Vehicles in Household
Income
Poverty
Unemployment
Labor Participation
Family Structure
Vehicle Availability
Education Level
Disability

Immigrants from Kenya 1 or more Vehicles in Household
Excellent

90.4%
1+ VEHICLES AVAILABLE
88.5/ 100
METRIC RATING
131st/ 347
METRIC RANK

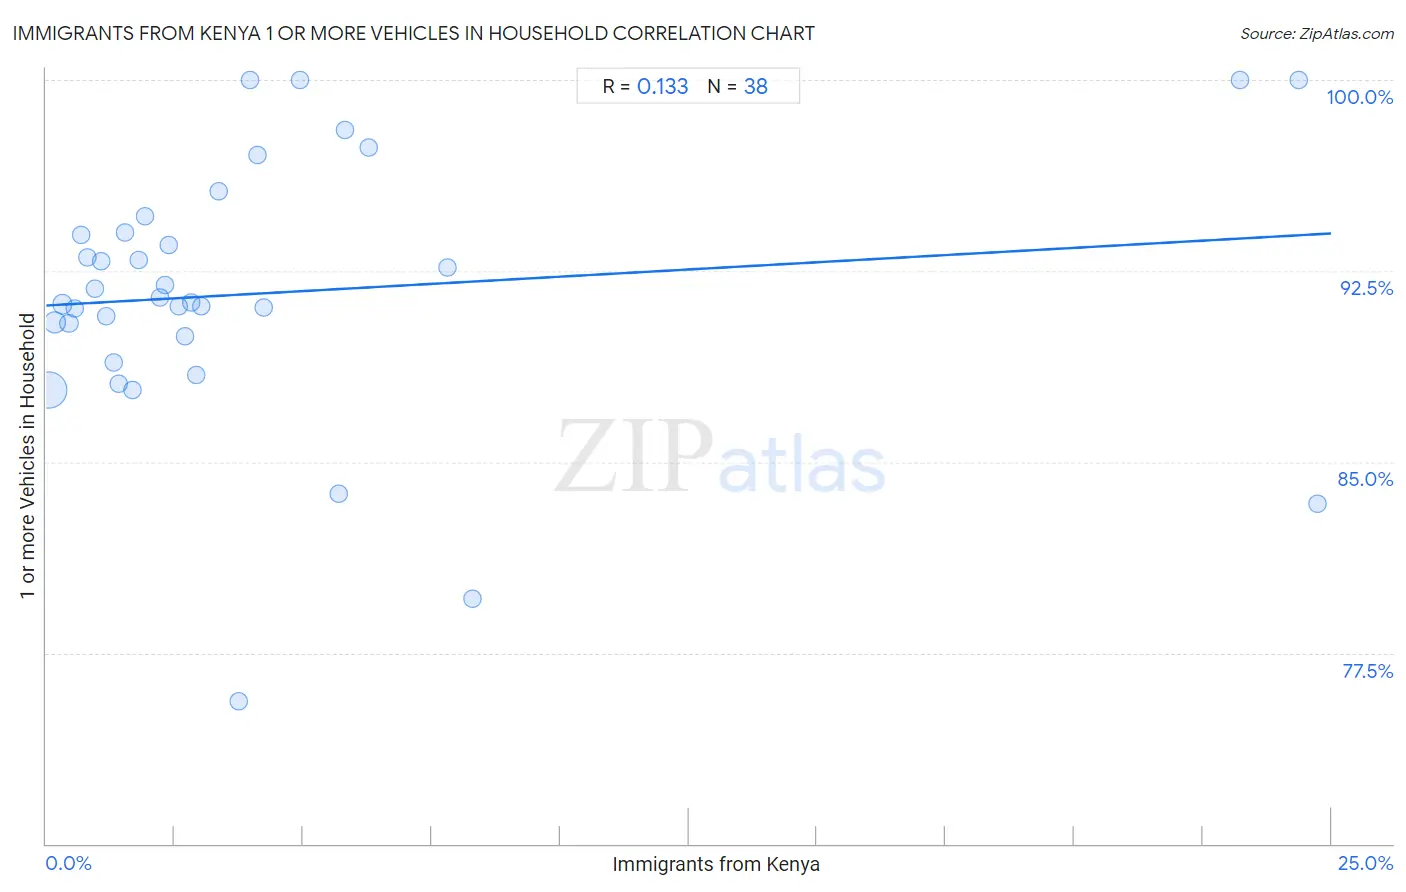
Immigrants from Kenya 1 or more Vehicles in Household Correlation Chart

The statistical analysis conducted on geographies consisting of 217,997,711 people shows a poor positive correlation between the proportion of Immigrants from Kenya and percentage of households with 1 or more vehicles available in the United States with a correlation coefficient (R) of 0.133 and weighted average of 90.4%. On average, for every 1% (one percent) increase in Immigrants from Kenya within a typical geography, there is an increase of 0.11% in percentage of households with 1 or more vehicles available.
Immigrants from Kenya 1 or more Vehicles in Household
It is essential to understand that the correlation between the percentage of Immigrants from Kenya and percentage of households with 1 or more vehicles available does not imply a direct cause-and-effect relationship. It remains uncertain whether the presence of Immigrants from Kenya influences an upward or downward trend in the level of percentage of households with 1 or more vehicles available within an area, or if Immigrants from Kenya simply ended up residing in those areas with higher or lower levels of percentage of households with 1 or more vehicles available due to other factors.

Demographics Similar to Immigrants from Kenya by 1 or more Vehicles in Household

In terms of 1 or more vehicles in household, the demographic groups most similar to Immigrants from Kenya are Nicaraguan (90.4%, a difference of 0.010%), Immigrants from South Africa (90.4%, a difference of 0.010%), Immigrants from the Azores (90.4%, a difference of 0.020%), Burmese (90.4%, a difference of 0.020%), and Marshallese (90.4%, a difference of 0.020%).
DemographicsRating | Rank1 or more Vehicles in Household
Puget Sound Salish
91.5
/100
|
#124
Exceptional
90.5%
Immigrants from Korea
90.5
/100
|
#125
Exceptional
90.5%
Immigrants from Cameroon
89.4
/100
|
#126
Excellent
90.4%
Immigrants from the Azores
89.1
/100
|
#127
Excellent
90.4%
Burmese
89.0
/100
|
#128
Excellent
90.4%
Marshallese
88.9
/100
|
#129
Excellent
90.4%
Nicaraguans
88.8
/100
|
#130
Excellent
90.4%
Immigrants from Kenya
88.5
/100
|
#131
Excellent
90.4%
Immigrants from South Africa
88.1
/100
|
#132
Excellent
90.4%
Immigrants from Syria
87.5
/100
|
#133
Excellent
90.4%
Kenyans
87.0
/100
|
#134
Excellent
90.4%
Immigrants from Oceania
86.9
/100
|
#135
Excellent
90.4%
Hungarians
86.5
/100
|
#136
Excellent
90.3%
Latvians
86.3
/100
|
#137
Excellent
90.3%
Syrians
86.3
/100
|
#138
Excellent
90.3%

Immigrants from Kenya 1 or more Vehicles in Household Correlation Summary

MeasurementImmigrants from Kenya Data1 or more Vehicles in Household Data
Minimum0.045%75.6%
Maximum24.7%100.0%
Range24.7%24.4%
Mean4.4%91.6%
Median2.5%91.4%
Interquartile 25% (IQ1)1.2%89.9%
Interquartile 75% (IQ3)4.2%94.0%
Interquartile Range (IQR)3.1%4.1%
Standard Deviation (Sample)6.2%5.3%
Standard Deviation (Population)6.1%5.2%

Correlation Details

Immigrants from Kenya PercentileSample Size1 or more Vehicles in Household
[
0.0%
-
0.5%
]
0.045%
154,706,32887.8%
[
0.0%
-
0.5%
]
0.17%
33,134,71790.5%
[
0.0%
-
0.5%
]
0.31%
12,122,02091.2%
[
0.0%
-
0.5%
]
0.44%
6,459,99290.4%
[
0.5%
-
1.0%
]
0.56%
3,977,98291.0%
[
0.5%
-
1.0%
]
0.67%
1,896,14293.9%
[
0.5%
-
1.0%
]
0.79%
1,466,09793.0%
[
0.5%
-
1.0%
]
0.94%
979,32791.8%
[
1.0%
-
1.5%
]
1.06%
825,39092.9%
[
1.0%
-
1.5%
]
1.16%
572,15190.7%
[
1.0%
-
1.5%
]
1.30%
389,44288.9%
[
1.0%
-
1.5%
]
1.42%
305,22788.1%
[
1.5%
-
2.0%
]
1.53%
261,89994.0%
[
1.5%
-
2.0%
]
1.68%
111,33187.8%
[
1.5%
-
2.0%
]
1.79%
229,90492.9%
[
1.5%
-
2.0%
]
1.92%
113,72094.6%
[
2.0%
-
2.5%
]
2.20%
191,12091.5%
[
2.0%
-
2.5%
]
2.30%
9,51592.0%
[
2.0%
-
2.5%
]
2.39%
55,33293.5%
[
2.5%
-
3.0%
]
2.58%
27,29091.1%
[
2.5%
-
3.0%
]
2.70%
16,08689.9%
[
2.5%
-
3.0%
]
2.82%
61,57891.3%
[
2.5%
-
3.0%
]
2.93%
16,88488.4%
[
3.0%
-
3.5%
]
3.02%
16,94791.1%
[
3.0%
-
3.5%
]
3.36%
2,61895.6%
[
3.5%
-
4.0%
]
3.74%
10,81175.6%
[
3.5%
-
4.0%
]
3.96%
227100.0%
[
4.0%
-
4.5%
]
4.10%
2,46497.0%
[
4.0%
-
4.5%
]
4.23%
24,00891.1%
[
4.5%
-
5.0%
]
4.94%
324100.0%
[
5.5%
-
6.0%
]
5.68%
3,83883.8%
[
5.5%
-
6.0%
]
5.82%
3,21498.0%
[
6.0%
-
6.5%
]
6.27%
1,40397.4%
[
7.5%
-
8.0%
]
7.80%
42392.6%
[
8.0%
-
8.5%
]
8.30%
1,15779.6%
[
23.0%
-
23.5%
]
23.22%
267100.0%
[
24.0%
-
24.5%
]
24.37%
439100.0%
[
24.5%
-
25.0%
]
24.74%
9783.3%