Immigrants from Guatemala vs Immigrants from France Self-Care Disability

COMPARE

Immigrants from Guatemala
Race
Ancestry
AfghanAfricanAlaska NativeAlaskan AthabascanAlbanianAleutAlsatianAmericanApacheArabArapahoArgentineanArmenianAssyrian/Chaldean/SyriacAustralianAustrianBahamianBangladeshiBarbadianBasqueBelgianBelizeanBermudanBhutaneseBlackfeetBolivianBrazilianBritishBritish West IndianBulgarianBurmeseCajunCambodianCanadianCape VerdeanCarpatho RusynCelticCentral AmericanCentral American IndianCherokeeCheyenneChickasawChileanChineseChippewaChoctawColombianColvilleComancheCosta RicanCreeCreekCroatianCrowCubanCypriotCzechCzechoslovakianDanishDelawareDominicanDutchDutch West IndianEastern EuropeanEcuadorianEgyptianEnglishEstonianEthiopianEuropeanFijianFilipinoFinnishFrenchFrench American IndianFrench CanadianGermanGerman RussianGhanaianGreekGuamanian/ChamorroGuatemalanGuyaneseHaitianHmongHonduranHopiHoumaHungarianIcelanderIndian (Asian)IndonesianInupiatIranianIraqiIrishIroquoisIsraeliItalianJamaicanJapaneseJordanianKenyanKiowaKoreanLaotianLatvianLebaneseLiberianLithuanianLumbeeLuxembourgerMacedonianMalaysianMalteseMarshalleseMenomineeMexicanMexican American IndianMongolianMoroccanNative HawaiianNavajoNepaleseNew ZealanderNicaraguanNigerianNorthern EuropeanNorwegianOkinawanOsageOttawaPaiutePakistaniPalestinianPanamanianParaguayanPennsylvania GermanPeruvianPimaPolishPortuguesePotawatomiPuebloPuerto RicanPuget Sound SalishRomanianRussianSalvadoranSamoanScandinavianScotch-IrishScottishSeminoleSenegaleseSerbianShoshoneSierra LeoneanSiouxSlavicSlovakSloveneSomaliSouth AfricanSouth AmericanSouth American IndianSoviet UnionSpaniardSpanishSpanish AmericanSpanish American IndianSri LankanSubsaharan AfricanSudaneseSwedishSwissSyrianTaiwaneseThaiTlingit-HaidaTohono O'OdhamTonganTrinidadian and TobagonianTsimshianTurkishU.S. Virgin IslanderUgandanUkrainianUruguayanUteVenezuelanVietnameseWelshWest IndianYakamaYaquiYugoslavianYumanYup'ikZimbabwean
Immigration
NonimmigrantsImmigrantsAfghanistanAfricaAlbaniaArgentinaArmeniaAsiaAustraliaAustriaBahamasBangladeshBarbadosBelarusBelgiumBelizeBoliviaBosnia and HerzegovinaBrazilBulgariaBurma/MyanmarCabo VerdeCambodiaCameroonCanadaCaribbeanCentral AmericaChileChinaColombiaCongoCosta RicaCroatiaCubaCzechoslovakiaDenmarkDominicaDominican RepublicEastern AfricaEastern AsiaEastern EuropeEcuadorEgyptEl SalvadorEnglandEritreaEthiopiaEuropeFijiGermanyGhanaGreeceGrenadaGuatemalaGuyanaHaitiHondurasHong KongHungaryIndiaIndonesiaIranIraqIrelandIsraelItalyJamaicaJapanJordanKazakhstanKenyaKoreaKuwaitLaosLatin AmericaLatviaLebanonLiberiaLithuaniaMalaysiaMexicoMicronesiaMiddle AfricaMoldovaMoroccoNepalNetherlandsNicaraguaNigeriaNorth AmericaNorth MacedoniaNorthern AfricaNorthern EuropeNorwayOceaniaPakistanPanamaPeruPhilippinesPolandPortugalRomaniaRussiaSaudi ArabiaScotlandSenegalSerbiaSierra LeoneSingaporeSomaliaSouth AfricaSouth AmericaSouth Central AsiaSouth Eastern AsiaSouthern EuropeSpainSri LankaSt. Vincent and the GrenadinesSudanSwedenSwitzerlandSyriaTaiwanThailandTrinidad and TobagoTurkeyUgandaUkraineUruguayUzbekistanVenezuelaVietnamWest IndiesWestern AfricaWestern AsiaWestern EuropeYemenZaireZimbabweAzores
Immigrants from France
Race
Ancestry
AfghanAfricanAlaska NativeAlaskan AthabascanAlbanianAleutAlsatianAmericanApacheArabArapahoArgentineanArmenianAssyrian/Chaldean/SyriacAustralianAustrianBahamianBangladeshiBarbadianBasqueBelgianBelizeanBermudanBhutaneseBlackfeetBolivianBrazilianBritishBritish West IndianBulgarianBurmeseCajunCambodianCanadianCape VerdeanCarpatho RusynCelticCentral AmericanCentral American IndianCherokeeCheyenneChickasawChileanChineseChippewaChoctawColombianColvilleComancheCosta RicanCreeCreekCroatianCrowCubanCypriotCzechCzechoslovakianDanishDelawareDominicanDutchDutch West IndianEastern EuropeanEcuadorianEgyptianEnglishEstonianEthiopianEuropeanFijianFilipinoFinnishFrenchFrench American IndianFrench CanadianGermanGerman RussianGhanaianGreekGuamanian/ChamorroGuatemalanGuyaneseHaitianHmongHonduranHopiHoumaHungarianIcelanderIndian (Asian)IndonesianInupiatIranianIraqiIrishIroquoisIsraeliItalianJamaicanJapaneseJordanianKenyanKiowaKoreanLaotianLatvianLebaneseLiberianLithuanianLumbeeLuxembourgerMacedonianMalaysianMalteseMarshalleseMenomineeMexicanMexican American IndianMongolianMoroccanNative HawaiianNavajoNepaleseNew ZealanderNicaraguanNigerianNorthern EuropeanNorwegianOkinawanOsageOttawaPaiutePakistaniPalestinianPanamanianParaguayanPennsylvania GermanPeruvianPimaPolishPortuguesePotawatomiPuebloPuerto RicanPuget Sound SalishRomanianRussianSalvadoranSamoanScandinavianScotch-IrishScottishSeminoleSenegaleseSerbianShoshoneSierra LeoneanSiouxSlavicSlovakSloveneSomaliSouth AfricanSouth AmericanSouth American IndianSoviet UnionSpaniardSpanishSpanish AmericanSpanish American IndianSri LankanSubsaharan AfricanSudaneseSwedishSwissSyrianTaiwaneseThaiTlingit-HaidaTohono O'OdhamTonganTrinidadian and TobagonianTsimshianTurkishU.S. Virgin IslanderUgandanUkrainianUruguayanUteVenezuelanVietnameseWelshWest IndianYakamaYaquiYugoslavianYumanYup'ikZimbabwean
Immigration
NonimmigrantsImmigrantsAfghanistanAfricaAlbaniaArgentinaArmeniaAsiaAustraliaAustriaBahamasBangladeshBarbadosBelarusBelgiumBelizeBoliviaBosnia and HerzegovinaBrazilBulgariaBurma/MyanmarCabo VerdeCambodiaCameroonCanadaCaribbeanCentral AmericaChileChinaColombiaCongoCosta RicaCroatiaCubaCzechoslovakiaDenmarkDominicaDominican RepublicEastern AfricaEastern AsiaEastern EuropeEcuadorEgyptEl SalvadorEnglandEritreaEthiopiaEuropeFijiFranceGermanyGhanaGreeceGrenadaGuyanaHaitiHondurasHong KongHungaryIndiaIndonesiaIranIraqIrelandIsraelItalyJamaicaJapanJordanKazakhstanKenyaKoreaKuwaitLaosLatin AmericaLatviaLebanonLiberiaLithuaniaMalaysiaMexicoMicronesiaMiddle AfricaMoldovaMoroccoNepalNetherlandsNicaraguaNigeriaNorth AmericaNorth MacedoniaNorthern AfricaNorthern EuropeNorwayOceaniaPakistanPanamaPeruPhilippinesPolandPortugalRomaniaRussiaSaudi ArabiaScotlandSenegalSerbiaSierra LeoneSingaporeSomaliaSouth AfricaSouth AmericaSouth Central AsiaSouth Eastern AsiaSouthern EuropeSpainSri LankaSt. Vincent and the GrenadinesSudanSwedenSwitzerlandSyriaTaiwanThailandTrinidad and TobagoTurkeyUgandaUkraineUruguayUzbekistanVenezuelaVietnamWest IndiesWestern AfricaWestern AsiaWestern EuropeYemenZaireZimbabweAzores
Self-Care Disability
Income
Poverty
Unemployment
Labor Participation
Family Structure
Vehicle Availability
Education Level
Disability

Self-Care Disability Comparison

Immigrants from Guatemala

Immigrants from France

Tragic
Exceptional
2.6%
SELF-CARE DISABILITY
2.2/ 100
METRIC RATING
231st/ 347
METRIC RANK
2.3%
SELF-CARE DISABILITY
99.6/ 100
METRIC RATING
55th/ 347
METRIC RANK

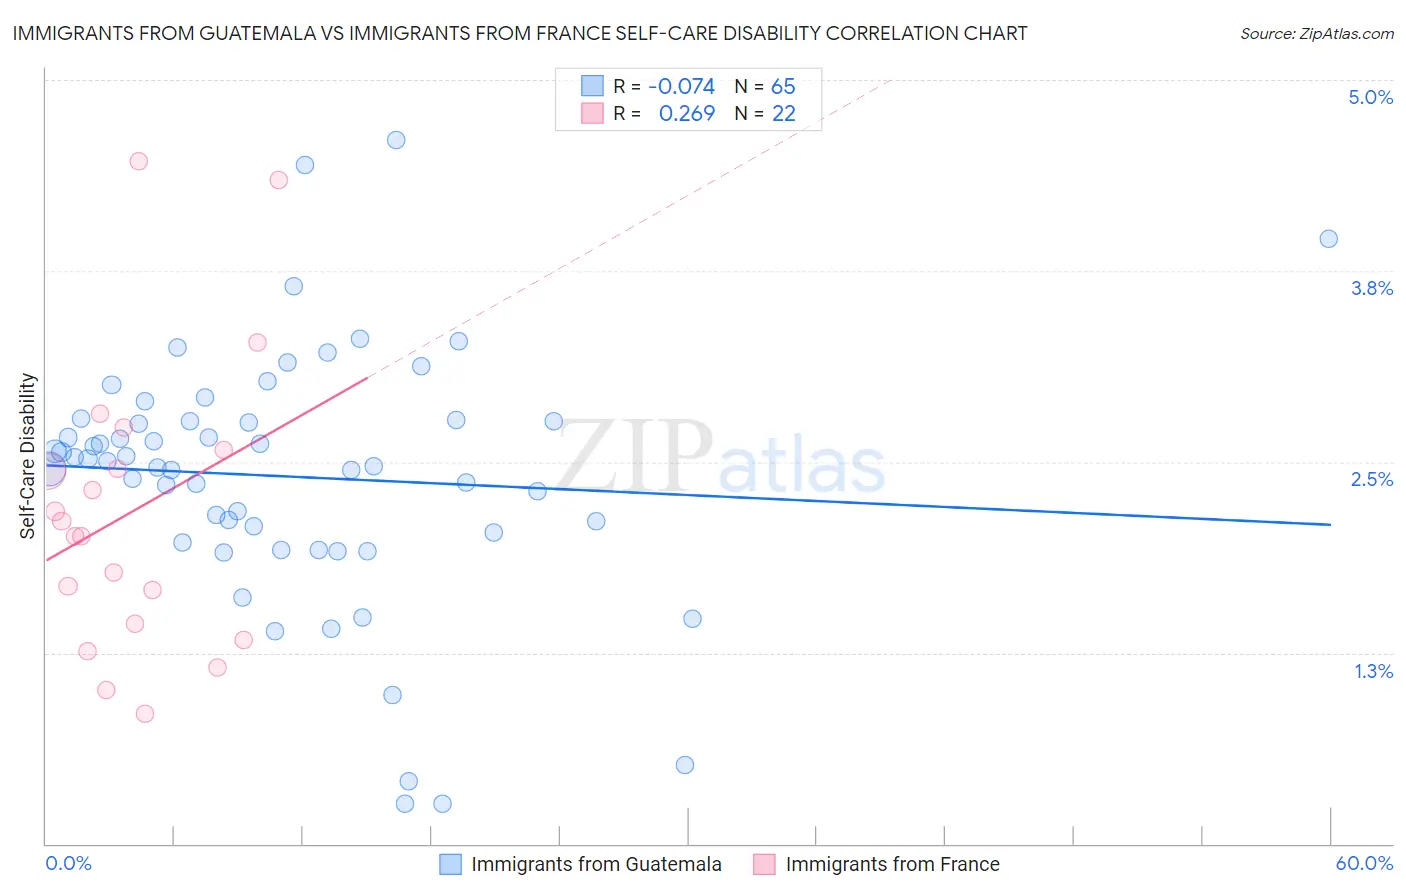
Immigrants from Guatemala vs Immigrants from France Self-Care Disability Correlation Chart

The statistical analysis conducted on geographies consisting of 376,972,339 people shows a slight negative correlation between the proportion of Immigrants from Guatemala and percentage of population with self-care disability in the United States with a correlation coefficient (R) of -0.074 and weighted average of 2.6%. Similarly, the statistical analysis conducted on geographies consisting of 287,704,144 people shows a weak positive correlation between the proportion of Immigrants from France and percentage of population with self-care disability in the United States with a correlation coefficient (R) of 0.269 and weighted average of 2.3%, a difference of 11.9%.
Immigrants from Guatemala vs Immigrants from France Self-Care Disability

Self-Care Disability Correlation Summary

MeasurementImmigrants from GuatemalaImmigrants from France
Minimum0.26%0.85%
Maximum4.6%4.5%
Range4.3%3.6%
Mean2.4%2.2%
Median2.5%2.1%
Interquartile 25% (IQ1)2.0%1.4%
Interquartile 75% (IQ3)2.8%2.6%
Interquartile Range (IQR)0.77%1.1%
Standard Deviation (Sample)0.84%0.96%
Standard Deviation (Population)0.83%0.93%

Similar Demographics by Self-Care Disability

Demographics Similar to Immigrants from Guatemala by Self-Care Disability

In terms of self-care disability, the demographic groups most similar to Immigrants from Guatemala are Albanian (2.6%, a difference of 0.030%), Liberian (2.6%, a difference of 0.070%), Vietnamese (2.6%, a difference of 0.070%), Bahamian (2.6%, a difference of 0.11%), and Guamanian/Chamorro (2.6%, a difference of 0.15%).
DemographicsRating | RankSelf-Care Disability
Osage
3.6
/100
|
#224
Tragic
2.6%
Iraqis
3.2
/100
|
#225
Tragic
2.6%
Chinese
2.9
/100
|
#226
Tragic
2.6%
Immigrants | Philippines
2.7
/100
|
#227
Tragic
2.6%
Guatemalans
2.7
/100
|
#228
Tragic
2.6%
Guamanians/Chamorros
2.5
/100
|
#229
Tragic
2.6%
Immigrants | Ecuador
2.5
/100
|
#230
Tragic
2.6%
Immigrants | Guatemala
2.2
/100
|
#231
Tragic
2.6%
Albanians
2.2
/100
|
#232
Tragic
2.6%
Liberians
2.1
/100
|
#233
Tragic
2.6%
Vietnamese
2.1
/100
|
#234
Tragic
2.6%
Bahamians
2.0
/100
|
#235
Tragic
2.6%
Bermudans
1.9
/100
|
#236
Tragic
2.6%
Immigrants | Senegal
1.6
/100
|
#237
Tragic
2.6%
Senegalese
1.3
/100
|
#238
Tragic
2.6%

Demographics Similar to Immigrants from France by Self-Care Disability

In terms of self-care disability, the demographic groups most similar to Immigrants from France are Immigrants from Eastern Asia (2.3%, a difference of 0.040%), Immigrants from Belgium (2.3%, a difference of 0.040%), Argentinean (2.3%, a difference of 0.060%), Australian (2.3%, a difference of 0.11%), and Immigrants from Cameroon (2.3%, a difference of 0.12%).
DemographicsRating | RankSelf-Care Disability
Immigrants | Malaysia
99.7
/100
|
#48
Exceptional
2.3%
Latvians
99.7
/100
|
#49
Exceptional
2.3%
Immigrants | Brazil
99.7
/100
|
#50
Exceptional
2.3%
Kenyans
99.7
/100
|
#51
Exceptional
2.3%
Immigrants | Serbia
99.6
/100
|
#52
Exceptional
2.3%
Australians
99.6
/100
|
#53
Exceptional
2.3%
Argentineans
99.6
/100
|
#54
Exceptional
2.3%
Immigrants | France
99.6
/100
|
#55
Exceptional
2.3%
Immigrants | Eastern Asia
99.6
/100
|
#56
Exceptional
2.3%
Immigrants | Belgium
99.6
/100
|
#57
Exceptional
2.3%
Immigrants | Cameroon
99.6
/100
|
#58
Exceptional
2.3%
New Zealanders
99.5
/100
|
#59
Exceptional
2.3%
Immigrants | Japan
99.5
/100
|
#60
Exceptional
2.3%
Palestinians
99.4
/100
|
#61
Exceptional
2.3%
Egyptians
99.4
/100
|
#62
Exceptional
2.3%