Pima Female Disability
COMPARE
Pima
Select to Compare
Female Disability
Pima Female Disability
14.8%
DISABILITY | FEMALES
0.0/ 100
METRIC RATING
332nd/ 347
METRIC RANK
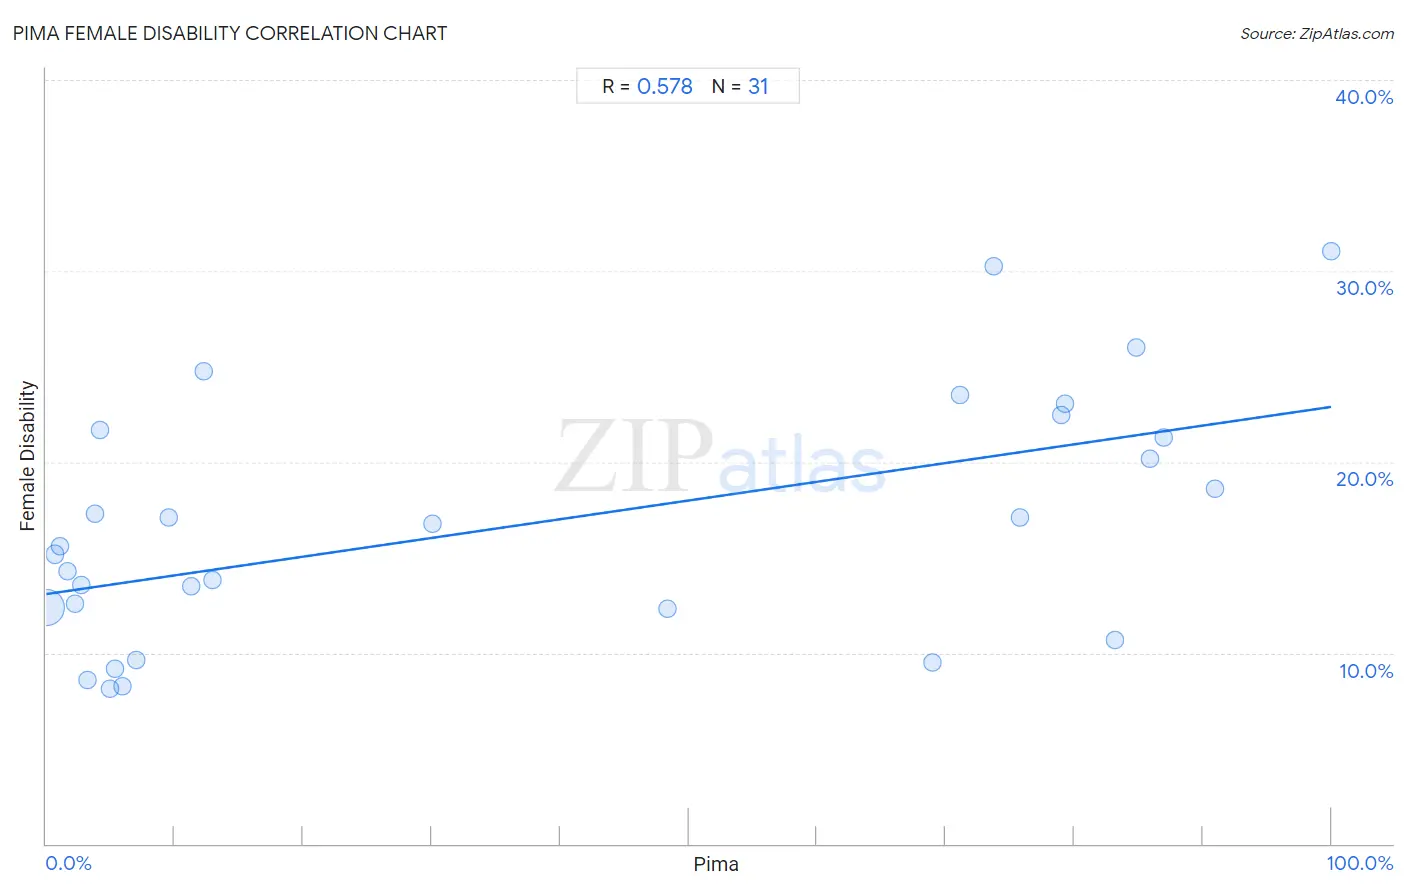
Pima Female Disability Correlation Chart
The statistical analysis conducted on geographies consisting of 61,537,754 people shows a substantial positive correlation between the proportion of Pima and percentage of females with a disability in the United States with a correlation coefficient (R) of 0.578 and weighted average of 14.8%. On average, for every 1% (one percent) increase in Pima within a typical geography, there is an increase of 0.098% in percentage of females with a disability.
It is essential to understand that the correlation between the percentage of Pima and percentage of females with a disability does not imply a direct cause-and-effect relationship. It remains uncertain whether the presence of Pima influences an upward or downward trend in the level of percentage of females with a disability within an area, or if Pima simply ended up residing in those areas with higher or lower levels of percentage of females with a disability due to other factors.
Demographics Similar to Pima by Female Disability
In terms of female disability, the demographic groups most similar to Pima are Immigrants from the Azores (14.9%, a difference of 0.39%), Cherokee (14.9%, a difference of 0.48%), Cajun (14.9%, a difference of 0.50%), Seminole (15.0%, a difference of 1.2%), and Tohono O'odham (15.0%, a difference of 1.3%).
| Demographics | Rating | Rank | Female Disability |
| Navajo | 0.0 /100 | #325 | Tragic 14.2% |
| Comanche | 0.0 /100 | #326 | Tragic 14.2% |
| Ottawa | 0.0 /100 | #327 | Tragic 14.2% |
| Cape Verdeans | 0.0 /100 | #328 | Tragic 14.2% |
| Osage | 0.0 /100 | #329 | Tragic 14.3% |
| Yuman | 0.0 /100 | #330 | Tragic 14.5% |
| Immigrants from Cabo Verde | 0.0 /100 | #331 | Tragic 14.6% |
| Pima | 0.0 /100 | #332 | Tragic 14.8% |
| Immigrants from the Azores | 0.0 /100 | #333 | Tragic 14.9% |
| Cherokee | 0.0 /100 | #334 | Tragic 14.9% |
| Cajuns | 0.0 /100 | #335 | Tragic 14.9% |
| Seminole | 0.0 /100 | #336 | Tragic 15.0% |
| Tohono O'odham | 0.0 /100 | #337 | Tragic 15.0% |
| Dutch West Indians | 0.0 /100 | #338 | Tragic 15.0% |
| Colville | 0.0 /100 | #339 | Tragic 15.1% |
Pima Female Disability Correlation Summary
| Measurement | Pima Data | Female Disability Data |
| Minimum | 0.038% | 8.1% |
| Maximum | 100.0% | 31.0% |
| Range | 100.0% | 22.9% |
| Mean | 37.0% | 16.7% |
| Median | 12.3% | 15.6% |
| Interquartile 25% (IQ1) | 3.8% | 12.3% |
| Interquartile 75% (IQ3) | 79.0% | 21.6% |
| Interquartile Range (IQR) | 75.2% | 9.3% |
| Standard Deviation (Sample) | 37.6% | 6.4% |
| Standard Deviation (Population) | 37.0% | 6.3% |
Correlation Details
| Pima Percentile | Sample Size | Female Disability |
[ 0.0% - 0.5% ] 0.038% | 60,538,176 | 12.4% |
[ 0.5% - 1.0% ] 0.71% | 537,759 | 15.2% |
[ 1.0% - 1.5% ] 1.10% | 224,372 | 15.6% |
[ 1.5% - 2.0% ] 1.66% | 66,702 | 14.3% |
[ 2.0% - 2.5% ] 2.23% | 53,054 | 12.6% |
[ 2.5% - 3.0% ] 2.76% | 5,078 | 13.6% |
[ 3.0% - 3.5% ] 3.20% | 7,278 | 8.6% |
[ 3.5% - 4.0% ] 3.77% | 3,426 | 17.3% |
[ 4.0% - 4.5% ] 4.15% | 5,836 | 21.6% |
[ 4.5% - 5.0% ] 4.99% | 51,156 | 8.1% |
[ 5.0% - 5.5% ] 5.35% | 505 | 9.1% |
[ 5.5% - 6.0% ] 5.92% | 2,027 | 8.2% |
[ 7.0% - 7.5% ] 7.01% | 1,370 | 9.6% |
[ 9.5% - 10.0% ] 9.57% | 115 | 17.1% |
[ 11.0% - 11.5% ] 11.29% | 17,830 | 13.5% |
[ 12.0% - 12.5% ] 12.28% | 1,270 | 24.7% |
[ 12.5% - 13.0% ] 12.92% | 387 | 13.8% |
[ 30.0% - 30.5% ] 30.03% | 383 | 16.8% |
[ 48.0% - 48.5% ] 48.39% | 965 | 12.3% |
[ 68.5% - 69.0% ] 68.98% | 332 | 9.5% |
[ 71.0% - 71.5% ] 71.13% | 478 | 23.5% |
[ 73.5% - 74.0% ] 73.77% | 385 | 30.2% |
[ 75.5% - 76.0% ] 75.80% | 1,835 | 17.1% |
[ 78.5% - 79.0% ] 78.99% | 2,713 | 22.5% |
[ 79.0% - 79.5% ] 79.26% | 4,538 | 23.0% |
[ 83.0% - 83.5% ] 83.14% | 4,139 | 10.6% |
[ 84.5% - 85.0% ] 84.86% | 733 | 26.0% |
[ 85.5% - 86.0% ] 85.85% | 615 | 20.1% |
[ 86.5% - 87.0% ] 86.98% | 3,265 | 21.3% |
[ 90.5% - 91.0% ] 90.94% | 806 | 18.6% |
[ 99.5% - 100.0% ] 100.00% | 226 | 31.0% |