Pima Disability Age Under 5
COMPARE
Pima
Select to Compare
Disability Age Under 5
Pima Disability Age Under 5
1.1%
DISABILITY | AGE UNDER 5
99.8/ 100
METRIC RATING
43rd/ 347
METRIC RANK
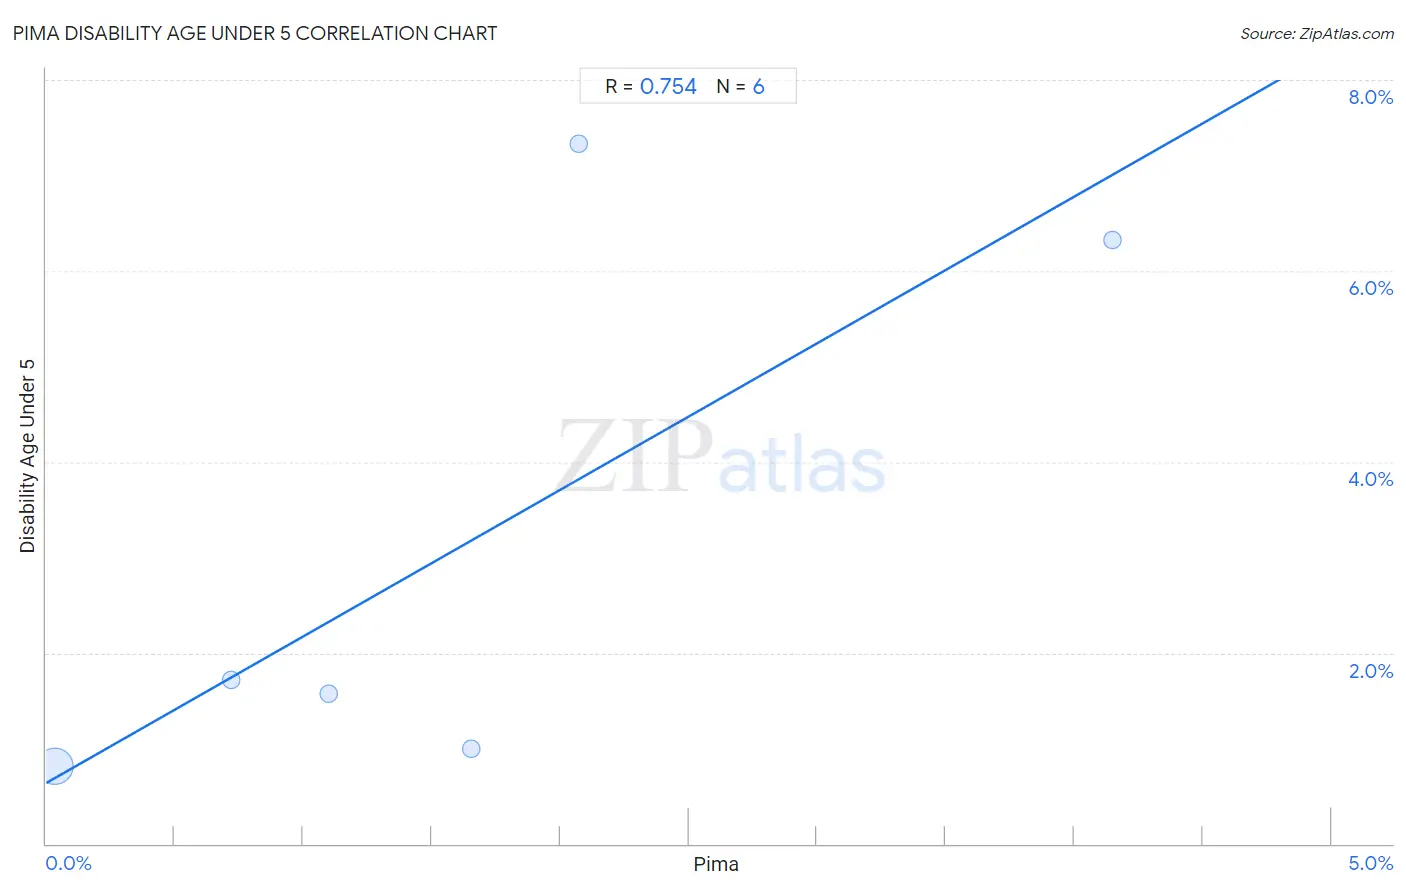
Pima Disability Age Under 5 Correlation Chart
The statistical analysis conducted on geographies consisting of 52,697,039 people shows a strong positive correlation between the proportion of Pima and percentage of population with a disability under the age of 5 in the United States with a correlation coefficient (R) of 0.754 and weighted average of 1.1%. On average, for every 1% (one percent) increase in Pima within a typical geography, there is an increase of 1.5% in percentage of population with a disability under the age of 5.
It is essential to understand that the correlation between the percentage of Pima and percentage of population with a disability under the age of 5 does not imply a direct cause-and-effect relationship. It remains uncertain whether the presence of Pima influences an upward or downward trend in the level of percentage of population with a disability under the age of 5 within an area, or if Pima simply ended up residing in those areas with higher or lower levels of percentage of population with a disability under the age of 5 due to other factors.
Demographics Similar to Pima by Disability Age Under 5
In terms of disability age under 5, the demographic groups most similar to Pima are Immigrants from Bulgaria (1.1%, a difference of 0.010%), Immigrants from Asia (1.1%, a difference of 0.090%), Thai (1.1%, a difference of 0.11%), Immigrants from Turkey (1.1%, a difference of 0.32%), and Immigrants from Albania (1.1%, a difference of 0.52%).
| Demographics | Rating | Rank | Disability Age Under 5 |
| Immigrants from Nepal | 99.9 /100 | #36 | Exceptional 1.0% |
| Immigrants from India | 99.9 /100 | #37 | Exceptional 1.0% |
| Immigrants from Guyana | 99.9 /100 | #38 | Exceptional 1.0% |
| Filipinos | 99.9 /100 | #39 | Exceptional 1.1% |
| Immigrants from Albania | 99.9 /100 | #40 | Exceptional 1.1% |
| Thais | 99.8 /100 | #41 | Exceptional 1.1% |
| Immigrants from Bulgaria | 99.8 /100 | #42 | Exceptional 1.1% |
| Pima | 99.8 /100 | #43 | Exceptional 1.1% |
| Immigrants from Asia | 99.8 /100 | #44 | Exceptional 1.1% |
| Immigrants from Turkey | 99.8 /100 | #45 | Exceptional 1.1% |
| Immigrants from Congo | 99.8 /100 | #46 | Exceptional 1.1% |
| Immigrants from Sweden | 99.8 /100 | #47 | Exceptional 1.1% |
| Immigrants from Singapore | 99.7 /100 | #48 | Exceptional 1.1% |
| Immigrants from Russia | 99.7 /100 | #49 | Exceptional 1.1% |
| Immigrants from Japan | 99.7 /100 | #50 | Exceptional 1.1% |
Pima Disability Age Under 5 Correlation Summary
| Measurement | Pima Data | Disability Age Under 5 Data |
| Minimum | 0.032% | 0.81% |
| Maximum | 4.1% | 7.3% |
| Range | 4.1% | 6.5% |
| Mean | 1.6% | 3.1% |
| Median | 1.4% | 1.6% |
| Interquartile 25% (IQ1) | 0.72% | 0.99% |
| Interquartile 75% (IQ3) | 2.1% | 6.3% |
| Interquartile Range (IQR) | 1.4% | 5.3% |
| Standard Deviation (Sample) | 1.4% | 2.9% |
| Standard Deviation (Population) | 1.3% | 2.7% |
Correlation Details
| Pima Percentile | Sample Size | Disability Age Under 5 |
[ 0.0% - 0.5% ] 0.032% | 52,130,871 | 0.81% |
[ 0.5% - 1.0% ] 0.72% | 320,975 | 1.7% |
[ 1.0% - 1.5% ] 1.10% | 182,825 | 1.6% |
[ 1.5% - 2.0% ] 1.65% | 53,296 | 0.99% |
[ 2.0% - 2.5% ] 2.07% | 3,478 | 7.3% |
[ 4.0% - 4.5% ] 4.15% | 5,594 | 6.3% |