Pima Married-Couple Family Poverty

COMPARE

Pima
Race
Ancestry
AfghanAfricanAlaska NativeAlaskan AthabascanAlbanianAleutAlsatianAmericanApacheArabArapahoArgentineanArmenianAssyrian/Chaldean/SyriacAustralianAustrianBahamianBangladeshiBarbadianBasqueBelgianBelizeanBermudanBhutaneseBlackfeetBolivianBrazilianBritishBritish West IndianBulgarianBurmeseCajunCambodianCanadianCape VerdeanCarpatho RusynCelticCentral AmericanCentral American IndianCherokeeCheyenneChickasawChileanChineseChippewaChoctawColombianColvilleComancheCosta RicanCreeCreekCroatianCrowCubanCypriotCzechCzechoslovakianDanishDelawareDominicanDutchDutch West IndianEastern EuropeanEcuadorianEgyptianEnglishEstonianEthiopianEuropeanFijianFilipinoFinnishFrenchFrench American IndianFrench CanadianGermanGerman RussianGhanaianGreekGuamanian/ChamorroGuatemalanGuyaneseHaitianHmongHonduranHopiHoumaHungarianIcelanderIndian (Asian)IndonesianInupiatIranianIraqiIrishIroquoisIsraeliItalianJamaicanJapaneseJordanianKenyanKiowaKoreanLaotianLatvianLebaneseLiberianLithuanianLumbeeLuxembourgerMacedonianMalaysianMalteseMarshalleseMenomineeMexicanMexican American IndianMongolianMoroccanNative HawaiianNavajoNepaleseNew ZealanderNicaraguanNigerianNorthern EuropeanNorwegianOkinawanOsageOttawaPaiutePakistaniPalestinianPanamanianParaguayanPennsylvania GermanPeruvianPimaPolishPortuguesePotawatomiPuebloPuerto RicanPuget Sound SalishRomanianRussianSalvadoranSamoanScandinavianScotch-IrishScottishSeminoleSenegaleseSerbianShoshoneSierra LeoneanSiouxSlavicSlovakSloveneSomaliSouth AfricanSouth AmericanSouth American IndianSoviet UnionSpaniardSpanishSpanish AmericanSpanish American IndianSri LankanSubsaharan AfricanSudaneseSwedishSwissSyrianTaiwaneseThaiTlingit-HaidaTohono O'OdhamTonganTrinidadian and TobagonianTsimshianTurkishU.S. Virgin IslanderUgandanUkrainianUruguayanUteVenezuelanVietnameseWelshWest IndianYakamaYaquiYugoslavianYumanYup'ikZimbabwean
Immigration
NonimmigrantsImmigrantsAfghanistanAfricaAlbaniaArgentinaArmeniaAsiaAustraliaAustriaBahamasBangladeshBarbadosBelarusBelgiumBelizeBoliviaBosnia and HerzegovinaBrazilBulgariaBurma/MyanmarCabo VerdeCambodiaCameroonCanadaCaribbeanCentral AmericaChileChinaColombiaCongoCosta RicaCroatiaCubaCzechoslovakiaDenmarkDominicaDominican RepublicEastern AfricaEastern AsiaEastern EuropeEcuadorEgyptEl SalvadorEnglandEritreaEthiopiaEuropeFijiFranceGermanyGhanaGreeceGrenadaGuatemalaGuyanaHaitiHondurasHong KongHungaryIndiaIndonesiaIranIraqIrelandIsraelItalyJamaicaJapanJordanKazakhstanKenyaKoreaKuwaitLaosLatin AmericaLatviaLebanonLiberiaLithuaniaMalaysiaMexicoMicronesiaMiddle AfricaMoldovaMoroccoNepalNetherlandsNicaraguaNigeriaNorth AmericaNorth MacedoniaNorthern AfricaNorthern EuropeNorwayOceaniaPakistanPanamaPeruPhilippinesPolandPortugalRomaniaRussiaSaudi ArabiaScotlandSenegalSerbiaSierra LeoneSingaporeSomaliaSouth AfricaSouth AmericaSouth Central AsiaSouth Eastern AsiaSouthern EuropeSpainSri LankaSt. Vincent and the GrenadinesSudanSwedenSwitzerlandSyriaTaiwanThailandTrinidad and TobagoTurkeyUgandaUkraineUruguayUzbekistanVenezuelaVietnamWest IndiesWestern AfricaWestern AsiaWestern EuropeYemenZaireZimbabweAzores
Select to Compare
Race
Ancestry
AfghanAfricanAlaska NativeAlaskan AthabascanAlbanianAleutAlsatianAmericanApacheArabArapahoArgentineanArmenianAssyrian/Chaldean/SyriacAustralianAustrianBahamianBangladeshiBarbadianBasqueBelgianBelizeanBermudanBhutaneseBlackfeetBolivianBrazilianBritishBritish West IndianBulgarianBurmeseCajunCambodianCanadianCape VerdeanCarpatho RusynCelticCentral AmericanCentral American IndianCherokeeCheyenneChickasawChileanChineseChippewaChoctawColombianColvilleComancheCosta RicanCreeCreekCroatianCrowCubanCypriotCzechCzechoslovakianDanishDelawareDominicanDutchDutch West IndianEastern EuropeanEcuadorianEgyptianEnglishEstonianEthiopianEuropeanFijianFilipinoFinnishFrenchFrench American IndianFrench CanadianGermanGerman RussianGhanaianGreekGuamanian/ChamorroGuatemalanGuyaneseHaitianHmongHonduranHopiHoumaHungarianIcelanderIndian (Asian)IndonesianInupiatIranianIraqiIrishIroquoisIsraeliItalianJamaicanJapaneseJordanianKenyanKiowaKoreanLaotianLatvianLebaneseLiberianLithuanianLumbeeLuxembourgerMacedonianMalaysianMalteseMarshalleseMenomineeMexicanMexican American IndianMongolianMoroccanNative HawaiianNavajoNepaleseNew ZealanderNicaraguanNigerianNorthern EuropeanNorwegianOkinawanOsageOttawaPaiutePakistaniPalestinianPanamanianParaguayanPennsylvania GermanPeruvianPolishPortuguesePotawatomiPuebloPuerto RicanPuget Sound SalishRomanianRussianSalvadoranSamoanScandinavianScotch-IrishScottishSeminoleSenegaleseSerbianShoshoneSierra LeoneanSiouxSlavicSlovakSloveneSomaliSouth AfricanSouth AmericanSouth American IndianSoviet UnionSpaniardSpanishSpanish AmericanSpanish American IndianSri LankanSubsaharan AfricanSudaneseSwedishSwissSyrianTaiwaneseThaiTlingit-HaidaTohono O'OdhamTonganTrinidadian and TobagonianTsimshianTurkishU.S. Virgin IslanderUgandanUkrainianUruguayanUteVenezuelanVietnameseWelshWest IndianYakamaYaquiYugoslavianYumanYup'ikZimbabwean
Immigration
NonimmigrantsImmigrantsAfghanistanAfricaAlbaniaArgentinaArmeniaAsiaAustraliaAustriaBahamasBangladeshBarbadosBelarusBelgiumBelizeBoliviaBosnia and HerzegovinaBrazilBulgariaBurma/MyanmarCabo VerdeCambodiaCameroonCanadaCaribbeanCentral AmericaChileChinaColombiaCongoCosta RicaCroatiaCubaCzechoslovakiaDenmarkDominicaDominican RepublicEastern AfricaEastern AsiaEastern EuropeEcuadorEgyptEl SalvadorEnglandEritreaEthiopiaEuropeFijiFranceGermanyGhanaGreeceGrenadaGuatemalaGuyanaHaitiHondurasHong KongHungaryIndiaIndonesiaIranIraqIrelandIsraelItalyJamaicaJapanJordanKazakhstanKenyaKoreaKuwaitLaosLatin AmericaLatviaLebanonLiberiaLithuaniaMalaysiaMexicoMicronesiaMiddle AfricaMoldovaMoroccoNepalNetherlandsNicaraguaNigeriaNorth AmericaNorth MacedoniaNorthern AfricaNorthern EuropeNorwayOceaniaPakistanPanamaPeruPhilippinesPolandPortugalRomaniaRussiaSaudi ArabiaScotlandSenegalSerbiaSierra LeoneSingaporeSomaliaSouth AfricaSouth AmericaSouth Central AsiaSouth Eastern AsiaSouthern EuropeSpainSri LankaSt. Vincent and the GrenadinesSudanSwedenSwitzerlandSyriaTaiwanThailandTrinidad and TobagoTurkeyUgandaUkraineUruguayUzbekistanVenezuelaVietnamWest IndiesWestern AfricaWestern AsiaWestern EuropeYemenZaireZimbabweAzores
Married-Couple Family Poverty
Income
Poverty
Unemployment
Labor Participation
Family Structure
Vehicle Availability
Education Level
Disability

Pima Married-Couple Family Poverty
Tragic

11.4%
POVERTY | MARRIED-COUPLE FAMILIES
0.0/ 100
METRIC RATING
343rd/ 347
METRIC RANK

Pima Married-Couple Family Poverty Correlation Chart

The statistical analysis conducted on geographies consisting of 61,466,640 people shows a significant positive correlation between the proportion of Pima and poverty level among married-couple families in the United States with a correlation coefficient (R) of 0.632 and weighted average of 11.4%. On average, for every 1% (one percent) increase in Pima within a typical geography, there is an increase of 0.42% in poverty level among married-couple families.
Pima Married-Couple Family Poverty
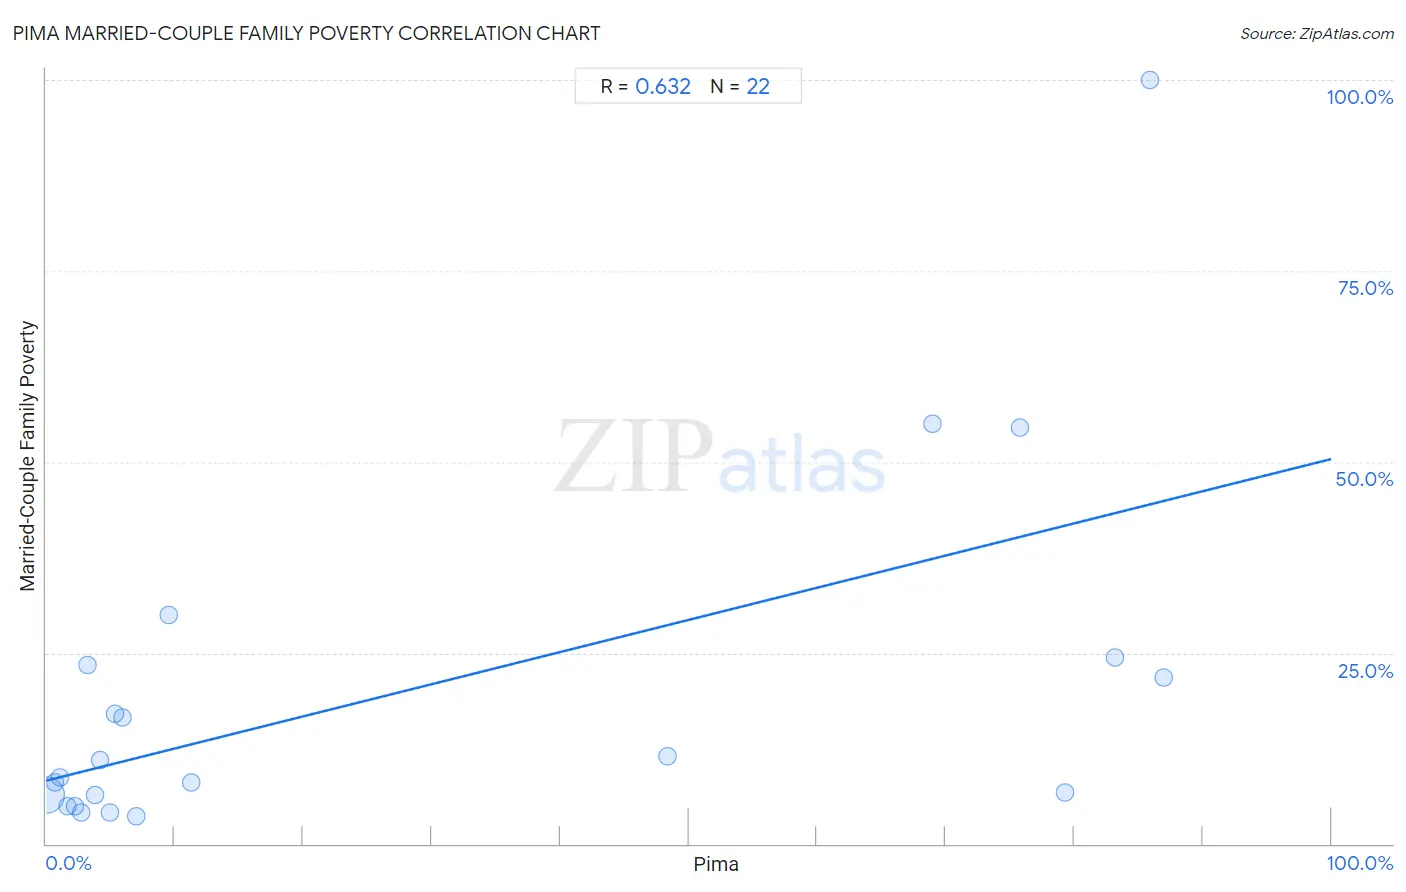
It is essential to understand that the correlation between the percentage of Pima and poverty level among married-couple families does not imply a direct cause-and-effect relationship. It remains uncertain whether the presence of Pima influences an upward or downward trend in the level of poverty level among married-couple families within an area, or if Pima simply ended up residing in those areas with higher or lower levels of poverty level among married-couple families due to other factors.

Demographics Similar to Pima by Married-Couple Family Poverty

In terms of married-couple family poverty, the demographic groups most similar to Pima are Tohono O'odham (11.2%, a difference of 1.7%), Pueblo (11.1%, a difference of 2.6%), Navajo (11.9%, a difference of 3.9%), Puerto Rican (12.6%, a difference of 10.8%), and Immigrants from Yemen (12.8%, a difference of 12.2%).
DemographicsRating | RankMarried-Couple Family Poverty
Lumbee
0.0
/100
|
#333
Tragic
8.3%
Immigrants from Dominican Republic
0.0
/100
|
#334
Tragic
8.4%
Sioux
0.0
/100
|
#335
Tragic
8.7%
Apache
0.0
/100
|
#336
Tragic
9.0%
Yakama
0.0
/100
|
#337
Tragic
9.0%
Cheyenne
0.0
/100
|
#338
Tragic
9.4%
Crow
0.0
/100
|
#339
Tragic
9.6%
Yuman
0.0
/100
|
#340
Tragic
9.7%
Pueblo
0.0
/100
|
#341
Tragic
11.1%
Tohono O'odham
0.0
/100
|
#342
Tragic
11.2%
Pima
0.0
/100
|
#343
Tragic
11.4%
Navajo
0.0
/100
|
#344
Tragic
11.9%
Puerto Ricans
0.0
/100
|
#345
Tragic
12.6%
Immigrants from Yemen
0.0
/100
|
#346
Tragic
12.8%
Yup'ik
0.0
/100
|
#347
Tragic
13.4%

Pima Married-Couple Family Poverty Correlation Summary

MeasurementPima DataMarried-Couple Family Poverty Data
Minimum0.038%3.6%
Maximum87.0%100.0%
Range86.9%96.4%
Mean26.9%19.6%
Median5.6%9.9%
Interquartile 25% (IQ1)2.8%6.4%
Interquartile 75% (IQ3)69.0%23.4%
Interquartile Range (IQR)66.2%17.0%
Standard Deviation (Sample)34.8%23.2%
Standard Deviation (Population)34.0%22.7%

Correlation Details

Pima PercentileSample SizeMarried-Couple Family Poverty
[
0.0%
-
0.5%
]
0.038%
60,500,0916.4%
[
0.5%
-
1.0%
]
0.71%
529,8848.1%
[
1.0%
-
1.5%
]
1.09%
218,6218.7%
[
1.5%
-
2.0%
]
1.65%
62,9215.0%
[
2.0%
-
2.5%
]
2.24%
47,0284.8%
[
2.5%
-
3.0%
]
2.76%
5,0784.1%
[
3.0%
-
3.5%
]
3.18%
4,42823.4%
[
3.5%
-
4.0%
]
3.77%
3,4266.4%
[
4.0%
-
4.5%
]
4.15%
5,83611.0%
[
4.5%
-
5.0%
]
4.99%
51,0964.1%
[
5.0%
-
5.5%
]
5.32%
1,37117.1%
[
5.5%
-
6.0%
]
5.92%
2,02716.5%
[
7.0%
-
7.5%
]
7.01%
1,3703.6%
[
9.5%
-
10.0%
]
9.57%
11530.0%
[
11.0%
-
11.5%
]
11.29%
17,6598.0%
[
48.0%
-
48.5%
]
48.39%
96511.5%
[
68.5%
-
69.0%
]
68.98%
33255.0%
[
75.5%
-
76.0%
]
75.80%
1,83554.5%
[
79.0%
-
79.5%
]
79.26%
4,5386.7%
[
83.0%
-
83.5%
]
83.14%
4,13924.4%
[
85.5%
-
86.0%
]
85.85%
615100.0%
[
86.5%
-
87.0%
]
86.98%
3,26521.7%