Pakistani vs Immigrants from Latin America Self-Care Disability

COMPARE

Pakistani
Race
Ancestry
AfghanAfricanAlaska NativeAlaskan AthabascanAlbanianAleutAlsatianAmericanApacheArabArapahoArgentineanArmenianAssyrian/Chaldean/SyriacAustralianAustrianBahamianBangladeshiBarbadianBasqueBelgianBelizeanBermudanBhutaneseBlackfeetBolivianBrazilianBritishBritish West IndianBulgarianBurmeseCajunCambodianCanadianCape VerdeanCarpatho RusynCelticCentral AmericanCentral American IndianCherokeeCheyenneChickasawChileanChineseChippewaChoctawColombianColvilleComancheCosta RicanCreeCreekCroatianCrowCubanCypriotCzechCzechoslovakianDanishDelawareDominicanDutchDutch West IndianEastern EuropeanEcuadorianEgyptianEnglishEstonianEthiopianEuropeanFijianFilipinoFinnishFrenchFrench American IndianFrench CanadianGermanGerman RussianGhanaianGreekGuamanian/ChamorroGuatemalanGuyaneseHaitianHmongHonduranHopiHoumaHungarianIcelanderIndian (Asian)IndonesianInupiatIranianIraqiIrishIroquoisIsraeliItalianJamaicanJapaneseJordanianKenyanKiowaKoreanLaotianLatvianLebaneseLiberianLithuanianLumbeeLuxembourgerMacedonianMalaysianMalteseMarshalleseMenomineeMexicanMexican American IndianMongolianMoroccanNative HawaiianNavajoNepaleseNew ZealanderNicaraguanNigerianNorthern EuropeanNorwegianOkinawanOsageOttawaPaiutePakistaniPalestinianPanamanianParaguayanPennsylvania GermanPeruvianPimaPolishPortuguesePotawatomiPuebloPuerto RicanPuget Sound SalishRomanianRussianSalvadoranSamoanScandinavianScotch-IrishScottishSeminoleSenegaleseSerbianShoshoneSierra LeoneanSiouxSlavicSlovakSloveneSomaliSouth AfricanSouth AmericanSouth American IndianSoviet UnionSpaniardSpanishSpanish AmericanSpanish American IndianSri LankanSubsaharan AfricanSudaneseSwedishSwissSyrianTaiwaneseThaiTlingit-HaidaTohono O'OdhamTonganTrinidadian and TobagonianTsimshianTurkishU.S. Virgin IslanderUgandanUkrainianUruguayanUteVenezuelanVietnameseWelshWest IndianYakamaYaquiYugoslavianYumanYup'ikZimbabwean
Immigration
NonimmigrantsImmigrantsAfghanistanAfricaAlbaniaArgentinaArmeniaAsiaAustraliaAustriaBahamasBangladeshBarbadosBelarusBelgiumBelizeBoliviaBosnia and HerzegovinaBrazilBulgariaBurma/MyanmarCabo VerdeCambodiaCameroonCanadaCaribbeanCentral AmericaChileChinaColombiaCongoCosta RicaCroatiaCubaCzechoslovakiaDenmarkDominicaDominican RepublicEastern AfricaEastern AsiaEastern EuropeEcuadorEgyptEl SalvadorEnglandEritreaEthiopiaEuropeFijiFranceGermanyGhanaGreeceGrenadaGuatemalaGuyanaHaitiHondurasHong KongHungaryIndiaIndonesiaIranIraqIrelandIsraelItalyJamaicaJapanJordanKazakhstanKenyaKoreaKuwaitLaosLatviaLebanonLiberiaLithuaniaMalaysiaMexicoMicronesiaMiddle AfricaMoldovaMoroccoNepalNetherlandsNicaraguaNigeriaNorth AmericaNorth MacedoniaNorthern AfricaNorthern EuropeNorwayOceaniaPakistanPanamaPeruPhilippinesPolandPortugalRomaniaRussiaSaudi ArabiaScotlandSenegalSerbiaSierra LeoneSingaporeSomaliaSouth AfricaSouth AmericaSouth Central AsiaSouth Eastern AsiaSouthern EuropeSpainSri LankaSt. Vincent and the GrenadinesSudanSwedenSwitzerlandSyriaTaiwanThailandTrinidad and TobagoTurkeyUgandaUkraineUruguayUzbekistanVenezuelaVietnamWest IndiesWestern AfricaWestern AsiaWestern EuropeYemenZaireZimbabweAzores
Immigrants from Latin America
Race
Ancestry
AfghanAfricanAlaska NativeAlaskan AthabascanAlbanianAleutAlsatianAmericanApacheArabArapahoArgentineanArmenianAssyrian/Chaldean/SyriacAustralianAustrianBahamianBangladeshiBarbadianBasqueBelgianBelizeanBermudanBhutaneseBlackfeetBolivianBrazilianBritishBritish West IndianBulgarianBurmeseCajunCambodianCanadianCape VerdeanCarpatho RusynCelticCentral AmericanCentral American IndianCherokeeCheyenneChickasawChileanChineseChippewaChoctawColombianColvilleComancheCosta RicanCreeCreekCroatianCrowCubanCypriotCzechCzechoslovakianDanishDelawareDominicanDutchDutch West IndianEastern EuropeanEcuadorianEgyptianEnglishEstonianEthiopianEuropeanFijianFilipinoFinnishFrenchFrench American IndianFrench CanadianGermanGerman RussianGhanaianGreekGuamanian/ChamorroGuatemalanGuyaneseHaitianHmongHonduranHopiHoumaHungarianIcelanderIndian (Asian)IndonesianInupiatIranianIraqiIrishIroquoisIsraeliItalianJamaicanJapaneseJordanianKenyanKiowaKoreanLaotianLatvianLebaneseLiberianLithuanianLumbeeLuxembourgerMacedonianMalaysianMalteseMarshalleseMenomineeMexicanMexican American IndianMongolianMoroccanNative HawaiianNavajoNepaleseNew ZealanderNicaraguanNigerianNorthern EuropeanNorwegianOkinawanOsageOttawaPaiutePalestinianPanamanianParaguayanPennsylvania GermanPeruvianPimaPolishPortuguesePotawatomiPuebloPuerto RicanPuget Sound SalishRomanianRussianSalvadoranSamoanScandinavianScotch-IrishScottishSeminoleSenegaleseSerbianShoshoneSierra LeoneanSiouxSlavicSlovakSloveneSomaliSouth AfricanSouth AmericanSouth American IndianSoviet UnionSpaniardSpanishSpanish AmericanSpanish American IndianSri LankanSubsaharan AfricanSudaneseSwedishSwissSyrianTaiwaneseThaiTlingit-HaidaTohono O'OdhamTonganTrinidadian and TobagonianTsimshianTurkishU.S. Virgin IslanderUgandanUkrainianUruguayanUteVenezuelanVietnameseWelshWest IndianYakamaYaquiYugoslavianYumanYup'ikZimbabwean
Immigration
NonimmigrantsImmigrantsAfghanistanAfricaAlbaniaArgentinaArmeniaAsiaAustraliaAustriaBahamasBangladeshBarbadosBelarusBelgiumBelizeBoliviaBosnia and HerzegovinaBrazilBulgariaBurma/MyanmarCabo VerdeCambodiaCameroonCanadaCaribbeanCentral AmericaChileChinaColombiaCongoCosta RicaCroatiaCubaCzechoslovakiaDenmarkDominicaDominican RepublicEastern AfricaEastern AsiaEastern EuropeEcuadorEgyptEl SalvadorEnglandEritreaEthiopiaEuropeFijiFranceGermanyGhanaGreeceGrenadaGuatemalaGuyanaHaitiHondurasHong KongHungaryIndiaIndonesiaIranIraqIrelandIsraelItalyJamaicaJapanJordanKazakhstanKenyaKoreaKuwaitLaosLatin AmericaLatviaLebanonLiberiaLithuaniaMalaysiaMexicoMicronesiaMiddle AfricaMoldovaMoroccoNepalNetherlandsNicaraguaNigeriaNorth AmericaNorth MacedoniaNorthern AfricaNorthern EuropeNorwayOceaniaPakistanPanamaPeruPhilippinesPolandPortugalRomaniaRussiaSaudi ArabiaScotlandSenegalSerbiaSierra LeoneSingaporeSomaliaSouth AfricaSouth AmericaSouth Central AsiaSouth Eastern AsiaSouthern EuropeSpainSri LankaSt. Vincent and the GrenadinesSudanSwedenSwitzerlandSyriaTaiwanThailandTrinidad and TobagoTurkeyUgandaUkraineUruguayUzbekistanVenezuelaVietnamWest IndiesWestern AfricaWestern AsiaWestern EuropeYemenZaireZimbabweAzores
Self-Care Disability
Income
Poverty
Unemployment
Labor Participation
Family Structure
Vehicle Availability
Education Level
Disability

Self-Care Disability Comparison

Pakistanis

Immigrants from Latin America

Good
Tragic
2.4%
SELF-CARE DISABILITY
71.4/ 100
METRIC RATING
155th/ 347
METRIC RANK
2.7%
SELF-CARE DISABILITY
0.2/ 100
METRIC RATING
263rd/ 347
METRIC RANK

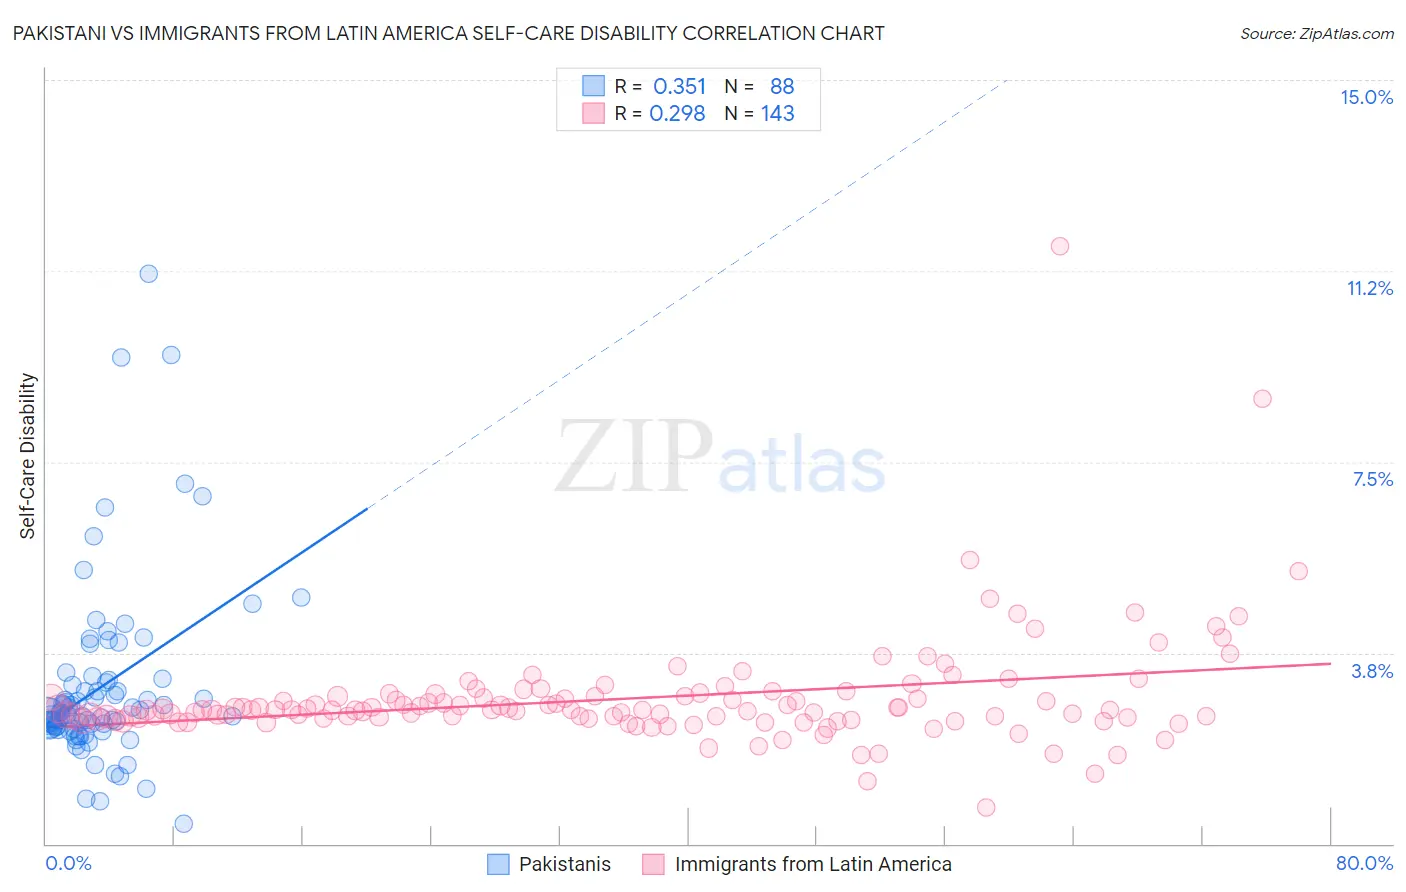
Pakistani vs Immigrants from Latin America Self-Care Disability Correlation Chart

The statistical analysis conducted on geographies consisting of 334,999,901 people shows a mild positive correlation between the proportion of Pakistanis and percentage of population with self-care disability in the United States with a correlation coefficient (R) of 0.351 and weighted average of 2.4%. Similarly, the statistical analysis conducted on geographies consisting of 556,721,677 people shows a weak positive correlation between the proportion of Immigrants from Latin America and percentage of population with self-care disability in the United States with a correlation coefficient (R) of 0.298 and weighted average of 2.7%, a difference of 8.7%.
Pakistani vs Immigrants from Latin America Self-Care Disability

Self-Care Disability Correlation Summary

MeasurementPakistaniImmigrants from Latin America
Minimum0.40%0.71%
Maximum11.2%11.7%
Range10.8%11.0%
Mean3.1%2.9%
Median2.5%2.6%
Interquartile 25% (IQ1)2.3%2.5%
Interquartile 75% (IQ3)3.2%2.9%
Interquartile Range (IQR)0.89%0.45%
Standard Deviation (Sample)1.8%1.1%
Standard Deviation (Population)1.8%1.1%

Similar Demographics by Self-Care Disability

Demographics Similar to Pakistanis by Self-Care Disability

In terms of self-care disability, the demographic groups most similar to Pakistanis are Italian (2.4%, a difference of 0.050%), Nigerian (2.4%, a difference of 0.050%), Immigrants from Europe (2.4%, a difference of 0.11%), Immigrants from England (2.4%, a difference of 0.12%), and Tlingit-Haida (2.4%, a difference of 0.13%).
DemographicsRating | RankSelf-Care Disability
Romanians
75.8
/100
|
#148
Good
2.4%
Arabs
75.7
/100
|
#149
Good
2.4%
Immigrants | Costa Rica
75.1
/100
|
#150
Good
2.4%
Basques
74.0
/100
|
#151
Good
2.4%
Tlingit-Haida
73.5
/100
|
#152
Good
2.4%
Immigrants | England
73.5
/100
|
#153
Good
2.4%
Italians
72.2
/100
|
#154
Good
2.4%
Pakistanis
71.4
/100
|
#155
Good
2.4%
Nigerians
70.6
/100
|
#156
Good
2.4%
Immigrants | Europe
69.6
/100
|
#157
Good
2.4%
Immigrants | Western Europe
68.6
/100
|
#158
Good
2.4%
Immigrants | Italy
68.5
/100
|
#159
Good
2.4%
Finns
67.0
/100
|
#160
Good
2.4%
Lebanese
66.5
/100
|
#161
Good
2.4%
Somalis
63.7
/100
|
#162
Good
2.5%

Demographics Similar to Immigrants from Latin America by Self-Care Disability

In terms of self-care disability, the demographic groups most similar to Immigrants from Latin America are Immigrants from Iran (2.7%, a difference of 0.060%), Shoshone (2.7%, a difference of 0.070%), Arapaho (2.6%, a difference of 0.21%), Immigrants from Nicaragua (2.7%, a difference of 0.22%), and Chippewa (2.6%, a difference of 0.23%).
DemographicsRating | RankSelf-Care Disability
Immigrants | Central America
0.3
/100
|
#256
Tragic
2.6%
Potawatomi
0.3
/100
|
#257
Tragic
2.6%
Immigrants | Nonimmigrants
0.3
/100
|
#258
Tragic
2.6%
Immigrants | Belarus
0.2
/100
|
#259
Tragic
2.6%
Chippewa
0.2
/100
|
#260
Tragic
2.6%
Arapaho
0.2
/100
|
#261
Tragic
2.6%
Shoshone
0.2
/100
|
#262
Tragic
2.7%
Immigrants | Latin America
0.2
/100
|
#263
Tragic
2.7%
Immigrants | Iran
0.2
/100
|
#264
Tragic
2.7%
Immigrants | Nicaragua
0.2
/100
|
#265
Tragic
2.7%
Immigrants | Cambodia
0.1
/100
|
#266
Tragic
2.7%
Yaqui
0.1
/100
|
#267
Tragic
2.7%
Immigrants | Mexico
0.1
/100
|
#268
Tragic
2.7%
U.S. Virgin Islanders
0.1
/100
|
#269
Tragic
2.7%
Immigrants | Micronesia
0.1
/100
|
#270
Tragic
2.7%