Immigrants from Saudi Arabia Married-couple Households

COMPARE

Immigrants from Saudi Arabia
Race
Ancestry
AfghanAfricanAlaska NativeAlaskan AthabascanAlbanianAleutAlsatianAmericanApacheArabArapahoArgentineanArmenianAssyrian/Chaldean/SyriacAustralianAustrianBahamianBangladeshiBarbadianBasqueBelgianBelizeanBermudanBhutaneseBlackfeetBolivianBrazilianBritishBritish West IndianBulgarianBurmeseCajunCambodianCanadianCape VerdeanCarpatho RusynCelticCentral AmericanCentral American IndianCherokeeCheyenneChickasawChileanChineseChippewaChoctawColombianColvilleComancheCosta RicanCreeCreekCroatianCrowCubanCypriotCzechCzechoslovakianDanishDelawareDominicanDutchDutch West IndianEastern EuropeanEcuadorianEgyptianEnglishEstonianEthiopianEuropeanFijianFilipinoFinnishFrenchFrench American IndianFrench CanadianGermanGerman RussianGhanaianGreekGuamanian/ChamorroGuatemalanGuyaneseHaitianHmongHonduranHopiHoumaHungarianIcelanderIndian (Asian)IndonesianInupiatIranianIraqiIrishIroquoisIsraeliItalianJamaicanJapaneseJordanianKenyanKiowaKoreanLaotianLatvianLebaneseLiberianLithuanianLumbeeLuxembourgerMacedonianMalaysianMalteseMarshalleseMenomineeMexicanMexican American IndianMongolianMoroccanNative HawaiianNavajoNepaleseNew ZealanderNicaraguanNigerianNorthern EuropeanNorwegianOkinawanOsageOttawaPaiutePakistaniPalestinianPanamanianParaguayanPennsylvania GermanPeruvianPimaPolishPortuguesePotawatomiPuebloPuerto RicanPuget Sound SalishRomanianRussianSalvadoranSamoanScandinavianScotch-IrishScottishSeminoleSenegaleseSerbianShoshoneSierra LeoneanSiouxSlavicSlovakSloveneSomaliSouth AfricanSouth AmericanSouth American IndianSoviet UnionSpaniardSpanishSpanish AmericanSpanish American IndianSri LankanSubsaharan AfricanSudaneseSwedishSwissSyrianTaiwaneseThaiTlingit-HaidaTohono O'OdhamTonganTrinidadian and TobagonianTsimshianTurkishU.S. Virgin IslanderUgandanUkrainianUruguayanUteVenezuelanVietnameseWelshWest IndianYakamaYaquiYugoslavianYumanYup'ikZimbabwean
Immigration
NonimmigrantsImmigrantsAfghanistanAfricaAlbaniaArgentinaArmeniaAsiaAustraliaAustriaBahamasBangladeshBarbadosBelarusBelgiumBelizeBoliviaBosnia and HerzegovinaBrazilBulgariaBurma/MyanmarCabo VerdeCambodiaCameroonCanadaCaribbeanCentral AmericaChileChinaColombiaCongoCosta RicaCroatiaCubaCzechoslovakiaDenmarkDominicaDominican RepublicEastern AfricaEastern AsiaEastern EuropeEcuadorEgyptEl SalvadorEnglandEritreaEthiopiaEuropeFijiFranceGermanyGhanaGreeceGrenadaGuatemalaGuyanaHaitiHondurasHong KongHungaryIndiaIndonesiaIranIraqIrelandIsraelItalyJamaicaJapanJordanKazakhstanKenyaKoreaKuwaitLaosLatin AmericaLatviaLebanonLiberiaLithuaniaMalaysiaMexicoMicronesiaMiddle AfricaMoldovaMoroccoNepalNetherlandsNicaraguaNigeriaNorth AmericaNorth MacedoniaNorthern AfricaNorthern EuropeNorwayOceaniaPakistanPanamaPeruPhilippinesPolandPortugalRomaniaRussiaSaudi ArabiaScotlandSenegalSerbiaSierra LeoneSingaporeSomaliaSouth AfricaSouth AmericaSouth Central AsiaSouth Eastern AsiaSouthern EuropeSpainSri LankaSt. Vincent and the GrenadinesSudanSwedenSwitzerlandSyriaTaiwanThailandTrinidad and TobagoTurkeyUgandaUkraineUruguayUzbekistanVenezuelaVietnamWest IndiesWestern AfricaWestern AsiaWestern EuropeYemenZaireZimbabweAzores
Select to Compare
Race
Ancestry
AfghanAfricanAlaska NativeAlaskan AthabascanAlbanianAleutAlsatianAmericanApacheArabArapahoArgentineanArmenianAssyrian/Chaldean/SyriacAustralianAustrianBahamianBangladeshiBarbadianBasqueBelgianBelizeanBermudanBhutaneseBlackfeetBolivianBrazilianBritishBritish West IndianBulgarianBurmeseCajunCambodianCanadianCape VerdeanCarpatho RusynCelticCentral AmericanCentral American IndianCherokeeCheyenneChickasawChileanChineseChippewaChoctawColombianColvilleComancheCosta RicanCreeCreekCroatianCrowCubanCypriotCzechCzechoslovakianDanishDelawareDominicanDutchDutch West IndianEastern EuropeanEcuadorianEgyptianEnglishEstonianEthiopianEuropeanFijianFilipinoFinnishFrenchFrench American IndianFrench CanadianGermanGerman RussianGhanaianGreekGuamanian/ChamorroGuatemalanGuyaneseHaitianHmongHonduranHopiHoumaHungarianIcelanderIndian (Asian)IndonesianInupiatIranianIraqiIrishIroquoisIsraeliItalianJamaicanJapaneseJordanianKenyanKiowaKoreanLaotianLatvianLebaneseLiberianLithuanianLumbeeLuxembourgerMacedonianMalaysianMalteseMarshalleseMenomineeMexicanMexican American IndianMongolianMoroccanNative HawaiianNavajoNepaleseNew ZealanderNicaraguanNigerianNorthern EuropeanNorwegianOkinawanOsageOttawaPaiutePakistaniPalestinianPanamanianParaguayanPennsylvania GermanPeruvianPimaPolishPortuguesePotawatomiPuebloPuerto RicanPuget Sound SalishRomanianRussianSalvadoranSamoanScandinavianScotch-IrishScottishSeminoleSenegaleseSerbianShoshoneSierra LeoneanSiouxSlavicSlovakSloveneSomaliSouth AfricanSouth AmericanSouth American IndianSoviet UnionSpaniardSpanishSpanish AmericanSpanish American IndianSri LankanSubsaharan AfricanSudaneseSwedishSwissSyrianTaiwaneseThaiTlingit-HaidaTohono O'OdhamTonganTrinidadian and TobagonianTsimshianTurkishU.S. Virgin IslanderUgandanUkrainianUruguayanUteVenezuelanVietnameseWelshWest IndianYakamaYaquiYugoslavianYumanYup'ikZimbabwean
Immigration
NonimmigrantsImmigrantsAfghanistanAfricaAlbaniaArgentinaArmeniaAsiaAustraliaAustriaBahamasBangladeshBarbadosBelarusBelgiumBelizeBoliviaBosnia and HerzegovinaBrazilBulgariaBurma/MyanmarCabo VerdeCambodiaCameroonCanadaCaribbeanCentral AmericaChileChinaColombiaCongoCosta RicaCroatiaCubaCzechoslovakiaDenmarkDominicaDominican RepublicEastern AfricaEastern AsiaEastern EuropeEcuadorEgyptEl SalvadorEnglandEritreaEthiopiaEuropeFijiFranceGermanyGhanaGreeceGrenadaGuatemalaGuyanaHaitiHondurasHong KongHungaryIndiaIndonesiaIranIraqIrelandIsraelItalyJamaicaJapanJordanKazakhstanKenyaKoreaKuwaitLaosLatin AmericaLatviaLebanonLiberiaLithuaniaMalaysiaMexicoMicronesiaMiddle AfricaMoldovaMoroccoNepalNetherlandsNicaraguaNigeriaNorth AmericaNorth MacedoniaNorthern AfricaNorthern EuropeNorwayOceaniaPakistanPanamaPeruPhilippinesPolandPortugalRomaniaRussiaScotlandSenegalSerbiaSierra LeoneSingaporeSomaliaSouth AfricaSouth AmericaSouth Central AsiaSouth Eastern AsiaSouthern EuropeSpainSri LankaSt. Vincent and the GrenadinesSudanSwedenSwitzerlandSyriaTaiwanThailandTrinidad and TobagoTurkeyUgandaUkraineUruguayUzbekistanVenezuelaVietnamWest IndiesWestern AfricaWestern AsiaWestern EuropeYemenZaireZimbabweAzores
Married-couple Households
Income
Poverty
Unemployment
Labor Participation
Family Structure
Vehicle Availability
Education Level
Disability

Immigrants from Saudi Arabia Married-couple Households
Tragic

44.4%
MARRIED-COUPLE HOUSEHOLDS
0.9/ 100
METRIC RATING
243rd/ 347
METRIC RANK

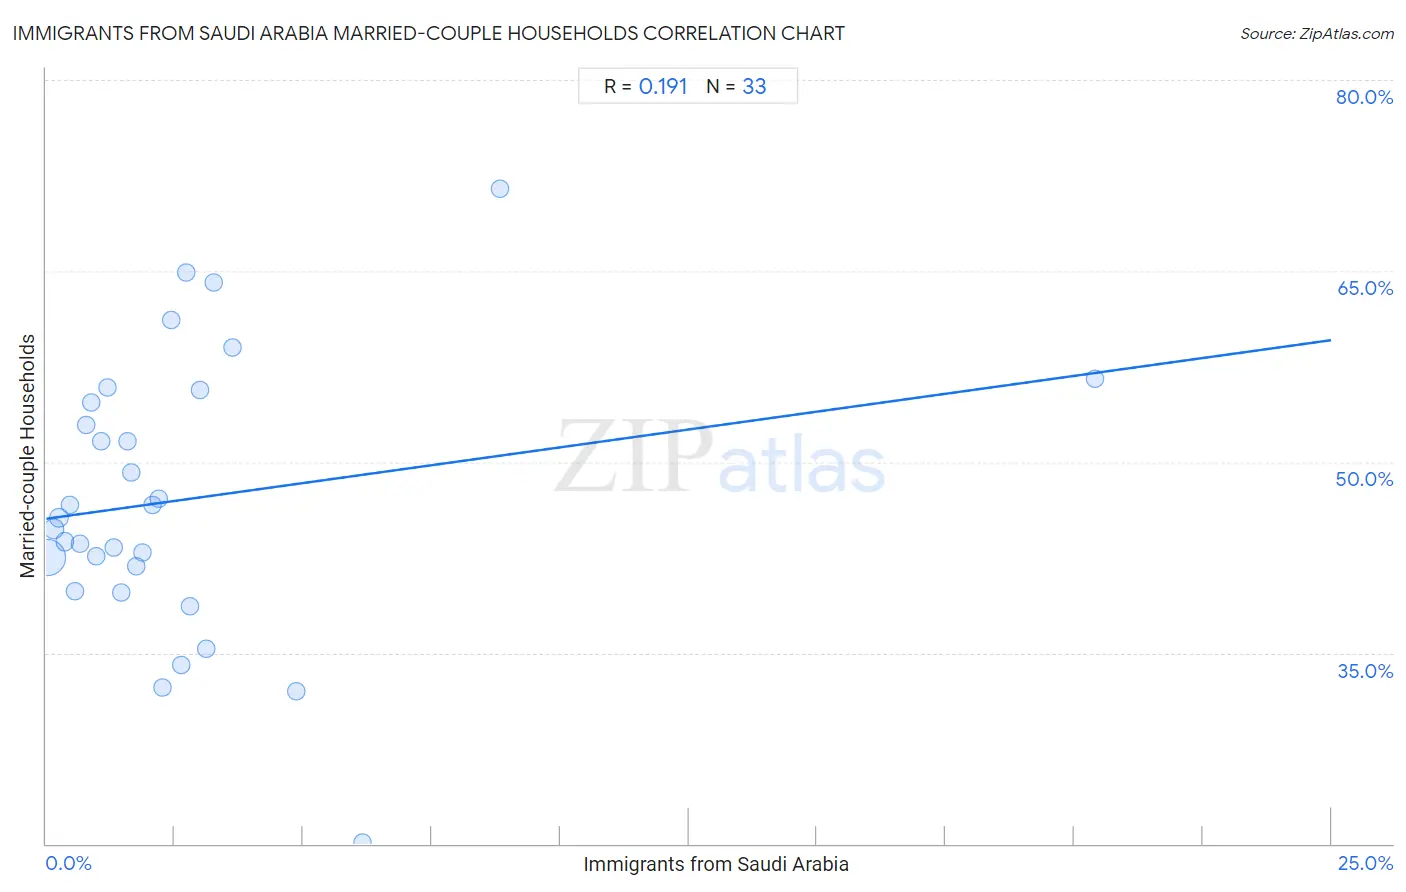
Immigrants from Saudi Arabia Married-couple Households Correlation Chart

The statistical analysis conducted on geographies consisting of 164,204,470 people shows a poor positive correlation between the proportion of Immigrants from Saudi Arabia and percentage of married-couple family households in the United States with a correlation coefficient (R) of 0.191 and weighted average of 44.4%. On average, for every 1% (one percent) increase in Immigrants from Saudi Arabia within a typical geography, there is an increase of 0.56% in percentage of married-couple family households.
Immigrants from Saudi Arabia Married-couple Households
It is essential to understand that the correlation between the percentage of Immigrants from Saudi Arabia and percentage of married-couple family households does not imply a direct cause-and-effect relationship. It remains uncertain whether the presence of Immigrants from Saudi Arabia influences an upward or downward trend in the level of percentage of married-couple family households within an area, or if Immigrants from Saudi Arabia simply ended up residing in those areas with higher or lower levels of percentage of married-couple family households due to other factors.

Demographics Similar to Immigrants from Saudi Arabia by Married-couple Households

In terms of married-couple households, the demographic groups most similar to Immigrants from Saudi Arabia are Immigrants from Albania (44.4%, a difference of 0.070%), Ute (44.4%, a difference of 0.11%), Immigrants from Bosnia and Herzegovina (44.4%, a difference of 0.11%), Spanish American (44.5%, a difference of 0.19%), and Immigrants from Uruguay (44.5%, a difference of 0.21%).
DemographicsRating | RankMarried-couple Households
Yaqui
1.2
/100
|
#236
Tragic
44.5%
Comanche
1.2
/100
|
#237
Tragic
44.5%
Immigrants from Uruguay
1.1
/100
|
#238
Tragic
44.5%
Spanish Americans
1.1
/100
|
#239
Tragic
44.5%
Ute
1.0
/100
|
#240
Tragic
44.4%
Immigrants from Bosnia and Herzegovina
1.0
/100
|
#241
Tragic
44.4%
Immigrants from Albania
1.0
/100
|
#242
Tragic
44.4%
Immigrants from Saudi Arabia
0.9
/100
|
#243
Tragic
44.4%
Immigrants from Armenia
0.7
/100
|
#244
Tragic
44.3%
Immigrants from El Salvador
0.7
/100
|
#245
Tragic
44.3%
Immigrants from Cuba
0.6
/100
|
#246
Tragic
44.2%
Immigrants from Morocco
0.6
/100
|
#247
Tragic
44.2%
Yup'ik
0.4
/100
|
#248
Tragic
44.1%
Immigrants from Kenya
0.4
/100
|
#249
Tragic
44.1%
French American Indians
0.4
/100
|
#250
Tragic
44.1%

Immigrants from Saudi Arabia Married-couple Households Correlation Summary

MeasurementImmigrants from Saudi Arabia DataMarried-couple Households Data
Minimum0.033%20.1%
Maximum20.4%71.4%
Range20.4%51.4%
Mean2.6%47.0%
Median1.7%45.6%
Interquartile 25% (IQ1)0.82%40.8%
Interquartile 75% (IQ3)2.9%55.2%
Interquartile Range (IQR)2.1%14.3%
Standard Deviation (Sample)3.7%10.8%
Standard Deviation (Population)3.6%10.6%

Correlation Details

Immigrants from Saudi Arabia PercentileSample SizeMarried-couple Households
[
0.0%
-
0.5%
]
0.033%
134,784,54842.5%
[
0.0%
-
0.5%
]
0.14%
17,145,59344.8%
[
0.0%
-
0.5%
]
0.25%
5,657,96945.6%
[
0.0%
-
0.5%
]
0.35%
2,779,83943.7%
[
0.0%
-
0.5%
]
0.45%
1,355,36446.6%
[
0.5%
-
1.0%
]
0.55%
623,84239.8%
[
0.5%
-
1.0%
]
0.66%
428,76043.6%
[
0.5%
-
1.0%
]
0.77%
509,27852.9%
[
0.5%
-
1.0%
]
0.87%
171,38654.7%
[
0.5%
-
1.0%
]
0.98%
225,15542.5%
[
1.0%
-
1.5%
]
1.06%
216,52351.7%
[
1.0%
-
1.5%
]
1.18%
72,35155.8%
[
1.0%
-
1.5%
]
1.31%
45,52043.3%
[
1.0%
-
1.5%
]
1.45%
23,31739.8%
[
1.5%
-
2.0%
]
1.59%
6,28751.6%
[
1.5%
-
2.0%
]
1.66%
11,87749.2%
[
1.5%
-
2.0%
]
1.74%
36,20841.8%
[
1.5%
-
2.0%
]
1.87%
18,31142.9%
[
2.0%
-
2.5%
]
2.06%
7,65446.6%
[
2.0%
-
2.5%
]
2.19%
10,58847.1%
[
2.0%
-
2.5%
]
2.27%
13,81432.3%
[
2.0%
-
2.5%
]
2.42%
9,69161.1%
[
2.5%
-
3.0%
]
2.62%
21,00034.0%
[
2.5%
-
3.0%
]
2.71%
8,65864.8%
[
2.5%
-
3.0%
]
2.79%
3,98338.6%
[
2.5%
-
3.0%
]
2.98%
8,65055.6%
[
3.0%
-
3.5%
]
3.11%
5,08835.3%
[
3.0%
-
3.5%
]
3.25%
1,78664.1%
[
3.5%
-
4.0%
]
3.62%
52559.0%
[
4.5%
-
5.0%
]
4.87%
34931.9%
[
6.0%
-
6.5%
]
6.15%
43920.1%
[
8.5%
-
9.0%
]
8.82%
6871.4%
[
20.0%
-
20.5%
]
20.41%
4956.5%