Immigrants from Saudi Arabia Wage/Income Gap

COMPARE

Immigrants from Saudi Arabia
Race
Ancestry
AfghanAfricanAlaska NativeAlaskan AthabascanAlbanianAleutAlsatianAmericanApacheArabArapahoArgentineanArmenianAssyrian/Chaldean/SyriacAustralianAustrianBahamianBangladeshiBarbadianBasqueBelgianBelizeanBermudanBhutaneseBlackfeetBolivianBrazilianBritishBritish West IndianBulgarianBurmeseCajunCambodianCanadianCape VerdeanCarpatho RusynCelticCentral AmericanCentral American IndianCherokeeCheyenneChickasawChileanChineseChippewaChoctawColombianColvilleComancheCosta RicanCreeCreekCroatianCrowCubanCypriotCzechCzechoslovakianDanishDelawareDominicanDutchDutch West IndianEastern EuropeanEcuadorianEgyptianEnglishEstonianEthiopianEuropeanFijianFilipinoFinnishFrenchFrench American IndianFrench CanadianGermanGerman RussianGhanaianGreekGuamanian/ChamorroGuatemalanGuyaneseHaitianHmongHonduranHopiHoumaHungarianIcelanderIndian (Asian)IndonesianInupiatIranianIraqiIrishIroquoisIsraeliItalianJamaicanJapaneseJordanianKenyanKiowaKoreanLaotianLatvianLebaneseLiberianLithuanianLumbeeLuxembourgerMacedonianMalaysianMalteseMarshalleseMenomineeMexicanMexican American IndianMongolianMoroccanNative HawaiianNavajoNepaleseNew ZealanderNicaraguanNigerianNorthern EuropeanNorwegianOkinawanOsageOttawaPaiutePakistaniPalestinianPanamanianParaguayanPennsylvania GermanPeruvianPimaPolishPortuguesePotawatomiPuebloPuerto RicanPuget Sound SalishRomanianRussianSalvadoranSamoanScandinavianScotch-IrishScottishSeminoleSenegaleseSerbianShoshoneSierra LeoneanSiouxSlavicSlovakSloveneSomaliSouth AfricanSouth AmericanSouth American IndianSoviet UnionSpaniardSpanishSpanish AmericanSpanish American IndianSri LankanSubsaharan AfricanSudaneseSwedishSwissSyrianTaiwaneseThaiTlingit-HaidaTohono O'OdhamTonganTrinidadian and TobagonianTsimshianTurkishU.S. Virgin IslanderUgandanUkrainianUruguayanUteVenezuelanVietnameseWelshWest IndianYakamaYaquiYugoslavianYumanYup'ikZimbabwean
Immigration
NonimmigrantsImmigrantsAfghanistanAfricaAlbaniaArgentinaArmeniaAsiaAustraliaAustriaBahamasBangladeshBarbadosBelarusBelgiumBelizeBoliviaBosnia and HerzegovinaBrazilBulgariaBurma/MyanmarCabo VerdeCambodiaCameroonCanadaCaribbeanCentral AmericaChileChinaColombiaCongoCosta RicaCroatiaCubaCzechoslovakiaDenmarkDominicaDominican RepublicEastern AfricaEastern AsiaEastern EuropeEcuadorEgyptEl SalvadorEnglandEritreaEthiopiaEuropeFijiFranceGermanyGhanaGreeceGrenadaGuatemalaGuyanaHaitiHondurasHong KongHungaryIndiaIndonesiaIranIraqIrelandIsraelItalyJamaicaJapanJordanKazakhstanKenyaKoreaKuwaitLaosLatin AmericaLatviaLebanonLiberiaLithuaniaMalaysiaMexicoMicronesiaMiddle AfricaMoldovaMoroccoNepalNetherlandsNicaraguaNigeriaNorth AmericaNorth MacedoniaNorthern AfricaNorthern EuropeNorwayOceaniaPakistanPanamaPeruPhilippinesPolandPortugalRomaniaRussiaSaudi ArabiaScotlandSenegalSerbiaSierra LeoneSingaporeSomaliaSouth AfricaSouth AmericaSouth Central AsiaSouth Eastern AsiaSouthern EuropeSpainSri LankaSt. Vincent and the GrenadinesSudanSwedenSwitzerlandSyriaTaiwanThailandTrinidad and TobagoTurkeyUgandaUkraineUruguayUzbekistanVenezuelaVietnamWest IndiesWestern AfricaWestern AsiaWestern EuropeYemenZaireZimbabweAzores
Select to Compare
Race
Ancestry
AfghanAfricanAlaska NativeAlaskan AthabascanAlbanianAleutAlsatianAmericanApacheArabArapahoArgentineanArmenianAssyrian/Chaldean/SyriacAustralianAustrianBahamianBangladeshiBarbadianBasqueBelgianBelizeanBermudanBhutaneseBlackfeetBolivianBrazilianBritishBritish West IndianBulgarianBurmeseCajunCambodianCanadianCape VerdeanCarpatho RusynCelticCentral AmericanCentral American IndianCherokeeCheyenneChickasawChileanChineseChippewaChoctawColombianColvilleComancheCosta RicanCreeCreekCroatianCrowCubanCypriotCzechCzechoslovakianDanishDelawareDominicanDutchDutch West IndianEastern EuropeanEcuadorianEgyptianEnglishEstonianEthiopianEuropeanFijianFilipinoFinnishFrenchFrench American IndianFrench CanadianGermanGerman RussianGhanaianGreekGuamanian/ChamorroGuatemalanGuyaneseHaitianHmongHonduranHopiHoumaHungarianIcelanderIndian (Asian)IndonesianInupiatIranianIraqiIrishIroquoisIsraeliItalianJamaicanJapaneseJordanianKenyanKiowaKoreanLaotianLatvianLebaneseLiberianLithuanianLumbeeLuxembourgerMacedonianMalaysianMalteseMarshalleseMenomineeMexicanMexican American IndianMongolianMoroccanNative HawaiianNavajoNepaleseNew ZealanderNicaraguanNigerianNorthern EuropeanNorwegianOkinawanOsageOttawaPaiutePakistaniPalestinianPanamanianParaguayanPennsylvania GermanPeruvianPimaPolishPortuguesePotawatomiPuebloPuerto RicanPuget Sound SalishRomanianRussianSalvadoranSamoanScandinavianScotch-IrishScottishSeminoleSenegaleseSerbianShoshoneSierra LeoneanSiouxSlavicSlovakSloveneSomaliSouth AfricanSouth AmericanSouth American IndianSoviet UnionSpaniardSpanishSpanish AmericanSpanish American IndianSri LankanSubsaharan AfricanSudaneseSwedishSwissSyrianTaiwaneseThaiTlingit-HaidaTohono O'OdhamTonganTrinidadian and TobagonianTsimshianTurkishU.S. Virgin IslanderUgandanUkrainianUruguayanUteVenezuelanVietnameseWelshWest IndianYakamaYaquiYugoslavianYumanYup'ikZimbabwean
Immigration
NonimmigrantsImmigrantsAfghanistanAfricaAlbaniaArgentinaArmeniaAsiaAustraliaAustriaBahamasBangladeshBarbadosBelarusBelgiumBelizeBoliviaBosnia and HerzegovinaBrazilBulgariaBurma/MyanmarCabo VerdeCambodiaCameroonCanadaCaribbeanCentral AmericaChileChinaColombiaCongoCosta RicaCroatiaCubaCzechoslovakiaDenmarkDominicaDominican RepublicEastern AfricaEastern AsiaEastern EuropeEcuadorEgyptEl SalvadorEnglandEritreaEthiopiaEuropeFijiFranceGermanyGhanaGreeceGrenadaGuatemalaGuyanaHaitiHondurasHong KongHungaryIndiaIndonesiaIranIraqIrelandIsraelItalyJamaicaJapanJordanKazakhstanKenyaKoreaKuwaitLaosLatin AmericaLatviaLebanonLiberiaLithuaniaMalaysiaMexicoMicronesiaMiddle AfricaMoldovaMoroccoNepalNetherlandsNicaraguaNigeriaNorth AmericaNorth MacedoniaNorthern AfricaNorthern EuropeNorwayOceaniaPakistanPanamaPeruPhilippinesPolandPortugalRomaniaRussiaScotlandSenegalSerbiaSierra LeoneSingaporeSomaliaSouth AfricaSouth AmericaSouth Central AsiaSouth Eastern AsiaSouthern EuropeSpainSri LankaSt. Vincent and the GrenadinesSudanSwedenSwitzerlandSyriaTaiwanThailandTrinidad and TobagoTurkeyUgandaUkraineUruguayUzbekistanVenezuelaVietnamWest IndiesWestern AfricaWestern AsiaWestern EuropeYemenZaireZimbabweAzores
Wage/Income Gap
Income
Poverty
Unemployment
Labor Participation
Family Structure
Vehicle Availability
Education Level
Disability

Immigrants from Saudi Arabia Wage/Income Gap
Tragic

26.7%
WAGE/INCOME GAP
9.1/ 100
METRIC RATING
218th/ 347
METRIC RANK

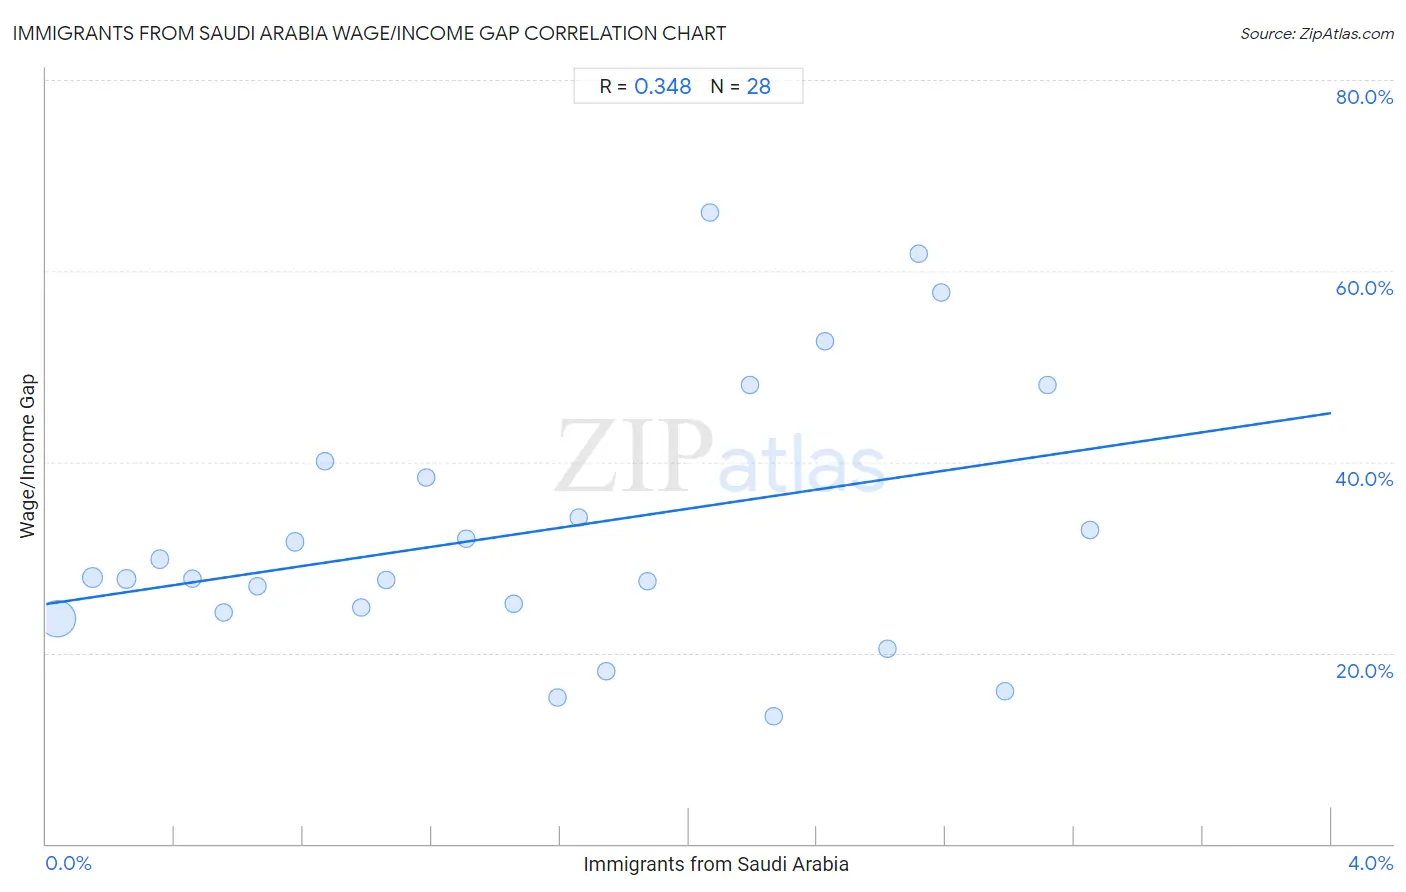
Immigrants from Saudi Arabia Wage/Income Gap Correlation Chart

The statistical analysis conducted on geographies consisting of 164,286,735 people shows a mild positive correlation between the proportion of Immigrants from Saudi Arabia and wage/income gap percentage in the United States with a correlation coefficient (R) of 0.348 and weighted average of 26.7%. On average, for every 1% (one percent) increase in Immigrants from Saudi Arabia within a typical geography, there is an increase of 5.0% in wage/income gap percentage.
Immigrants from Saudi Arabia Wage/Income Gap
It is essential to understand that the correlation between the percentage of Immigrants from Saudi Arabia and wage/income gap percentage does not imply a direct cause-and-effect relationship. It remains uncertain whether the presence of Immigrants from Saudi Arabia influences an upward or downward trend in the level of wage/income gap percentage within an area, or if Immigrants from Saudi Arabia simply ended up residing in those areas with higher or lower levels of wage/income gap percentage due to other factors.

Demographics Similar to Immigrants from Saudi Arabia by Wage/Income Gap

In terms of wage/income gap, the demographic groups most similar to Immigrants from Saudi Arabia are Brazilian (26.7%, a difference of 0.030%), Immigrants from Poland (26.7%, a difference of 0.030%), Immigrants from Latvia (26.7%, a difference of 0.040%), Immigrants from Portugal (26.7%, a difference of 0.080%), and Immigrants from Spain (26.8%, a difference of 0.11%).
DemographicsRating | RankWage/Income Gap
Mongolians
11.4
/100
|
#211
Poor
26.6%
Iraqis
11.2
/100
|
#212
Poor
26.6%
Immigrants from Iraq
10.3
/100
|
#213
Poor
26.7%
Immigrants from China
10.3
/100
|
#214
Poor
26.7%
Yugoslavians
9.7
/100
|
#215
Tragic
26.7%
Immigrants from Portugal
9.5
/100
|
#216
Tragic
26.7%
Brazilians
9.2
/100
|
#217
Tragic
26.7%
Immigrants from Saudi Arabia
9.1
/100
|
#218
Tragic
26.7%
Immigrants from Poland
8.9
/100
|
#219
Tragic
26.7%
Immigrants from Latvia
8.9
/100
|
#220
Tragic
26.7%
Immigrants from Spain
8.5
/100
|
#221
Tragic
26.8%
Bolivians
8.3
/100
|
#222
Tragic
26.8%
Jordanians
8.0
/100
|
#223
Tragic
26.8%
Immigrants from Argentina
7.2
/100
|
#224
Tragic
26.8%
Immigrants from Ireland
6.5
/100
|
#225
Tragic
26.9%

Immigrants from Saudi Arabia Wage/Income Gap Correlation Summary

MeasurementImmigrants from Saudi Arabia DataWage/Income Gap Data
Minimum0.033%13.4%
Maximum3.2%66.1%
Range3.2%52.7%
Mean1.5%32.8%
Median1.5%27.8%
Interquartile 25% (IQ1)0.72%24.5%
Interquartile 75% (IQ3)2.3%39.2%
Interquartile Range (IQR)1.6%14.8%
Standard Deviation (Sample)0.98%14.0%
Standard Deviation (Population)0.96%13.8%

Correlation Details

Immigrants from Saudi Arabia PercentileSample SizeWage/Income Gap
[
0.0%
-
0.5%
]
0.033%
134,828,52823.6%
[
0.0%
-
0.5%
]
0.14%
17,159,82727.9%
[
0.0%
-
0.5%
]
0.25%
5,666,54227.7%
[
0.0%
-
0.5%
]
0.35%
2,786,73229.8%
[
0.0%
-
0.5%
]
0.45%
1,352,25827.8%
[
0.5%
-
1.0%
]
0.55%
623,84224.2%
[
0.5%
-
1.0%
]
0.66%
429,84227.0%
[
0.5%
-
1.0%
]
0.77%
509,27831.6%
[
0.5%
-
1.0%
]
0.87%
172,73040.1%
[
0.5%
-
1.0%
]
0.98%
237,85524.7%
[
1.0%
-
1.5%
]
1.06%
213,13327.7%
[
1.0%
-
1.5%
]
1.18%
72,35138.3%
[
1.0%
-
1.5%
]
1.31%
45,52032.0%
[
1.0%
-
1.5%
]
1.45%
23,31725.2%
[
1.5%
-
2.0%
]
1.59%
6,28715.3%
[
1.5%
-
2.0%
]
1.66%
11,87734.2%
[
1.5%
-
2.0%
]
1.74%
36,20818.0%
[
1.5%
-
2.0%
]
1.87%
18,31127.4%
[
2.0%
-
2.5%
]
2.06%
7,65466.1%
[
2.0%
-
2.5%
]
2.19%
10,58848.0%
[
2.0%
-
2.5%
]
2.27%
13,81413.4%
[
2.0%
-
2.5%
]
2.42%
9,69152.6%
[
2.5%
-
3.0%
]
2.62%
20,73420.5%
[
2.5%
-
3.0%
]
2.71%
8,65861.8%
[
2.5%
-
3.0%
]
2.79%
3,98357.8%
[
2.5%
-
3.0%
]
2.98%
8,65016.0%
[
3.0%
-
3.5%
]
3.12%
6,73948.1%
[
3.0%
-
3.5%
]
3.25%
1,78632.8%