Immigrants from Saudi Arabia 1 or more Vehicles in Household

COMPARE

Immigrants from Saudi Arabia
Race
Ancestry
AfghanAfricanAlaska NativeAlaskan AthabascanAlbanianAleutAlsatianAmericanApacheArabArapahoArgentineanArmenianAssyrian/Chaldean/SyriacAustralianAustrianBahamianBangladeshiBarbadianBasqueBelgianBelizeanBermudanBhutaneseBlackfeetBolivianBrazilianBritishBritish West IndianBulgarianBurmeseCajunCambodianCanadianCape VerdeanCarpatho RusynCelticCentral AmericanCentral American IndianCherokeeCheyenneChickasawChileanChineseChippewaChoctawColombianColvilleComancheCosta RicanCreeCreekCroatianCrowCubanCypriotCzechCzechoslovakianDanishDelawareDominicanDutchDutch West IndianEastern EuropeanEcuadorianEgyptianEnglishEstonianEthiopianEuropeanFijianFilipinoFinnishFrenchFrench American IndianFrench CanadianGermanGerman RussianGhanaianGreekGuamanian/ChamorroGuatemalanGuyaneseHaitianHmongHonduranHopiHoumaHungarianIcelanderIndian (Asian)IndonesianInupiatIranianIraqiIrishIroquoisIsraeliItalianJamaicanJapaneseJordanianKenyanKiowaKoreanLaotianLatvianLebaneseLiberianLithuanianLumbeeLuxembourgerMacedonianMalaysianMalteseMarshalleseMenomineeMexicanMexican American IndianMongolianMoroccanNative HawaiianNavajoNepaleseNew ZealanderNicaraguanNigerianNorthern EuropeanNorwegianOkinawanOsageOttawaPaiutePakistaniPalestinianPanamanianParaguayanPennsylvania GermanPeruvianPimaPolishPortuguesePotawatomiPuebloPuerto RicanPuget Sound SalishRomanianRussianSalvadoranSamoanScandinavianScotch-IrishScottishSeminoleSenegaleseSerbianShoshoneSierra LeoneanSiouxSlavicSlovakSloveneSomaliSouth AfricanSouth AmericanSouth American IndianSoviet UnionSpaniardSpanishSpanish AmericanSpanish American IndianSri LankanSubsaharan AfricanSudaneseSwedishSwissSyrianTaiwaneseThaiTlingit-HaidaTohono O'OdhamTonganTrinidadian and TobagonianTsimshianTurkishU.S. Virgin IslanderUgandanUkrainianUruguayanUteVenezuelanVietnameseWelshWest IndianYakamaYaquiYugoslavianYumanYup'ikZimbabwean
Immigration
NonimmigrantsImmigrantsAfghanistanAfricaAlbaniaArgentinaArmeniaAsiaAustraliaAustriaBahamasBangladeshBarbadosBelarusBelgiumBelizeBoliviaBosnia and HerzegovinaBrazilBulgariaBurma/MyanmarCabo VerdeCambodiaCameroonCanadaCaribbeanCentral AmericaChileChinaColombiaCongoCosta RicaCroatiaCubaCzechoslovakiaDenmarkDominicaDominican RepublicEastern AfricaEastern AsiaEastern EuropeEcuadorEgyptEl SalvadorEnglandEritreaEthiopiaEuropeFijiFranceGermanyGhanaGreeceGrenadaGuatemalaGuyanaHaitiHondurasHong KongHungaryIndiaIndonesiaIranIraqIrelandIsraelItalyJamaicaJapanJordanKazakhstanKenyaKoreaKuwaitLaosLatin AmericaLatviaLebanonLiberiaLithuaniaMalaysiaMexicoMicronesiaMiddle AfricaMoldovaMoroccoNepalNetherlandsNicaraguaNigeriaNorth AmericaNorth MacedoniaNorthern AfricaNorthern EuropeNorwayOceaniaPakistanPanamaPeruPhilippinesPolandPortugalRomaniaRussiaSaudi ArabiaScotlandSenegalSerbiaSierra LeoneSingaporeSomaliaSouth AfricaSouth AmericaSouth Central AsiaSouth Eastern AsiaSouthern EuropeSpainSri LankaSt. Vincent and the GrenadinesSudanSwedenSwitzerlandSyriaTaiwanThailandTrinidad and TobagoTurkeyUgandaUkraineUruguayUzbekistanVenezuelaVietnamWest IndiesWestern AfricaWestern AsiaWestern EuropeYemenZaireZimbabweAzores
Select to Compare
Race
Ancestry
AfghanAfricanAlaska NativeAlaskan AthabascanAlbanianAleutAlsatianAmericanApacheArabArapahoArgentineanArmenianAssyrian/Chaldean/SyriacAustralianAustrianBahamianBangladeshiBarbadianBasqueBelgianBelizeanBermudanBhutaneseBlackfeetBolivianBrazilianBritishBritish West IndianBulgarianBurmeseCajunCambodianCanadianCape VerdeanCarpatho RusynCelticCentral AmericanCentral American IndianCherokeeCheyenneChickasawChileanChineseChippewaChoctawColombianColvilleComancheCosta RicanCreeCreekCroatianCrowCubanCypriotCzechCzechoslovakianDanishDelawareDominicanDutchDutch West IndianEastern EuropeanEcuadorianEgyptianEnglishEstonianEthiopianEuropeanFijianFilipinoFinnishFrenchFrench American IndianFrench CanadianGermanGerman RussianGhanaianGreekGuamanian/ChamorroGuatemalanGuyaneseHaitianHmongHonduranHopiHoumaHungarianIcelanderIndian (Asian)IndonesianInupiatIranianIraqiIrishIroquoisIsraeliItalianJamaicanJapaneseJordanianKenyanKiowaKoreanLaotianLatvianLebaneseLiberianLithuanianLumbeeLuxembourgerMacedonianMalaysianMalteseMarshalleseMenomineeMexicanMexican American IndianMongolianMoroccanNative HawaiianNavajoNepaleseNew ZealanderNicaraguanNigerianNorthern EuropeanNorwegianOkinawanOsageOttawaPaiutePakistaniPalestinianPanamanianParaguayanPennsylvania GermanPeruvianPimaPolishPortuguesePotawatomiPuebloPuerto RicanPuget Sound SalishRomanianRussianSalvadoranSamoanScandinavianScotch-IrishScottishSeminoleSenegaleseSerbianShoshoneSierra LeoneanSiouxSlavicSlovakSloveneSomaliSouth AfricanSouth AmericanSouth American IndianSoviet UnionSpaniardSpanishSpanish AmericanSpanish American IndianSri LankanSubsaharan AfricanSudaneseSwedishSwissSyrianTaiwaneseThaiTlingit-HaidaTohono O'OdhamTonganTrinidadian and TobagonianTsimshianTurkishU.S. Virgin IslanderUgandanUkrainianUruguayanUteVenezuelanVietnameseWelshWest IndianYakamaYaquiYugoslavianYumanYup'ikZimbabwean
Immigration
NonimmigrantsImmigrantsAfghanistanAfricaAlbaniaArgentinaArmeniaAsiaAustraliaAustriaBahamasBangladeshBarbadosBelarusBelgiumBelizeBoliviaBosnia and HerzegovinaBrazilBulgariaBurma/MyanmarCabo VerdeCambodiaCameroonCanadaCaribbeanCentral AmericaChileChinaColombiaCongoCosta RicaCroatiaCubaCzechoslovakiaDenmarkDominicaDominican RepublicEastern AfricaEastern AsiaEastern EuropeEcuadorEgyptEl SalvadorEnglandEritreaEthiopiaEuropeFijiFranceGermanyGhanaGreeceGrenadaGuatemalaGuyanaHaitiHondurasHong KongHungaryIndiaIndonesiaIranIraqIrelandIsraelItalyJamaicaJapanJordanKazakhstanKenyaKoreaKuwaitLaosLatin AmericaLatviaLebanonLiberiaLithuaniaMalaysiaMexicoMicronesiaMiddle AfricaMoldovaMoroccoNepalNetherlandsNicaraguaNigeriaNorth AmericaNorth MacedoniaNorthern AfricaNorthern EuropeNorwayOceaniaPakistanPanamaPeruPhilippinesPolandPortugalRomaniaRussiaScotlandSenegalSerbiaSierra LeoneSingaporeSomaliaSouth AfricaSouth AmericaSouth Central AsiaSouth Eastern AsiaSouthern EuropeSpainSri LankaSt. Vincent and the GrenadinesSudanSwedenSwitzerlandSyriaTaiwanThailandTrinidad and TobagoTurkeyUgandaUkraineUruguayUzbekistanVenezuelaVietnamWest IndiesWestern AfricaWestern AsiaWestern EuropeYemenZaireZimbabweAzores
1 or more Vehicles in Household
Income
Poverty
Unemployment
Labor Participation
Family Structure
Vehicle Availability
Education Level
Disability

Immigrants from Saudi Arabia 1 or more Vehicles in Household
Good

89.9%
1+ VEHICLES AVAILABLE
62.6/ 100
METRIC RATING
165th/ 347
METRIC RANK

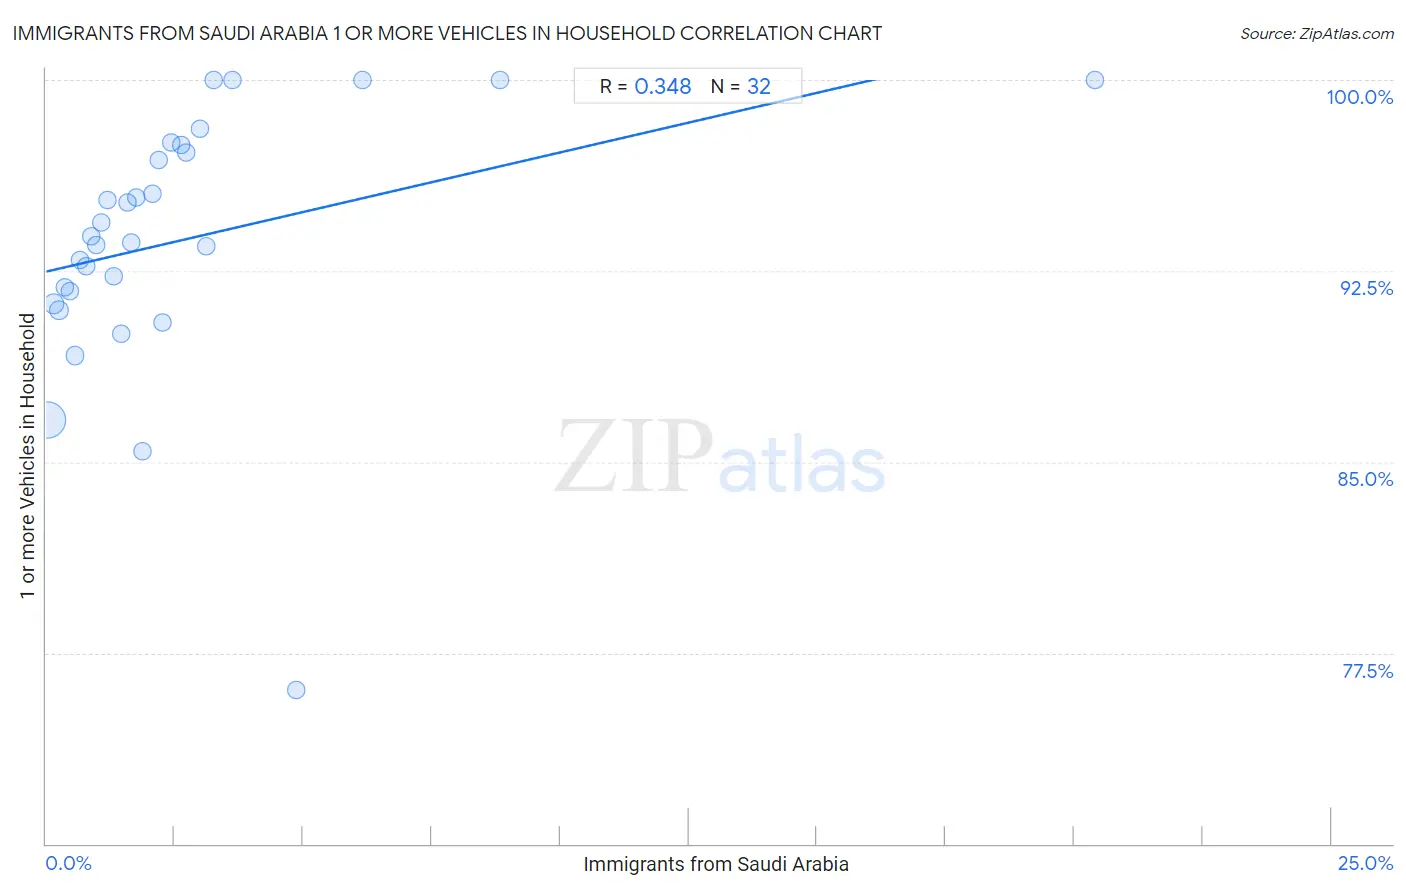
Immigrants from Saudi Arabia 1 or more Vehicles in Household Correlation Chart

The statistical analysis conducted on geographies consisting of 164,213,788 people shows a mild positive correlation between the proportion of Immigrants from Saudi Arabia and percentage of households with 1 or more vehicles available in the United States with a correlation coefficient (R) of 0.348 and weighted average of 89.9%. On average, for every 1% (one percent) increase in Immigrants from Saudi Arabia within a typical geography, there is an increase of 0.47% in percentage of households with 1 or more vehicles available.
Immigrants from Saudi Arabia 1 or more Vehicles in Household
It is essential to understand that the correlation between the percentage of Immigrants from Saudi Arabia and percentage of households with 1 or more vehicles available does not imply a direct cause-and-effect relationship. It remains uncertain whether the presence of Immigrants from Saudi Arabia influences an upward or downward trend in the level of percentage of households with 1 or more vehicles available within an area, or if Immigrants from Saudi Arabia simply ended up residing in those areas with higher or lower levels of percentage of households with 1 or more vehicles available due to other factors.

Demographics Similar to Immigrants from Saudi Arabia by 1 or more Vehicles in Household

In terms of 1 or more vehicles in household, the demographic groups most similar to Immigrants from Saudi Arabia are Comanche (89.9%, a difference of 0.010%), Immigrants from Middle Africa (89.9%, a difference of 0.010%), Immigrants from Latin America (89.8%, a difference of 0.040%), Immigrants from Cambodia (89.8%, a difference of 0.040%), and Immigrants from Austria (89.9%, a difference of 0.050%).
DemographicsRating | Rank1 or more Vehicles in Household
Brazilians
71.0
/100
|
#158
Good
90.0%
South Africans
69.7
/100
|
#159
Good
90.0%
Immigrants from Indonesia
68.8
/100
|
#160
Good
90.0%
Salvadorans
68.7
/100
|
#161
Good
90.0%
Spanish American Indians
67.0
/100
|
#162
Good
89.9%
Immigrants from Austria
65.5
/100
|
#163
Good
89.9%
Comanche
63.4
/100
|
#164
Good
89.9%
Immigrants from Saudi Arabia
62.6
/100
|
#165
Good
89.9%
Immigrants from Middle Africa
62.2
/100
|
#166
Good
89.9%
Immigrants from Latin America
60.3
/100
|
#167
Good
89.8%
Immigrants from Cambodia
60.1
/100
|
#168
Good
89.8%
Natives/Alaskans
59.5
/100
|
#169
Average
89.8%
Immigrants from Costa Rica
57.6
/100
|
#170
Average
89.8%
French American Indians
54.4
/100
|
#171
Average
89.8%
Indonesians
53.0
/100
|
#172
Average
89.7%

Immigrants from Saudi Arabia 1 or more Vehicles in Household Correlation Summary

MeasurementImmigrants from Saudi Arabia Data1 or more Vehicles in Household Data
Minimum0.033%76.0%
Maximum20.4%100.0%
Range20.4%24.0%
Mean2.6%93.7%
Median1.7%93.7%
Interquartile 25% (IQ1)0.82%91.5%
Interquartile 75% (IQ3)2.8%97.3%
Interquartile Range (IQR)2.0%5.8%
Standard Deviation (Sample)3.7%5.0%
Standard Deviation (Population)3.7%4.9%

Correlation Details

Immigrants from Saudi Arabia PercentileSample Size1 or more Vehicles in Household
[
0.0%
-
0.5%
]
0.033%
134,794,51186.6%
[
0.0%
-
0.5%
]
0.14%
17,148,93191.2%
[
0.0%
-
0.5%
]
0.25%
5,657,96991.0%
[
0.0%
-
0.5%
]
0.35%
2,779,83991.8%
[
0.0%
-
0.5%
]
0.45%
1,355,36491.7%
[
0.5%
-
1.0%
]
0.55%
623,84289.2%
[
0.5%
-
1.0%
]
0.66%
428,76092.9%
[
0.5%
-
1.0%
]
0.77%
509,27892.7%
[
0.5%
-
1.0%
]
0.87%
171,38693.9%
[
0.5%
-
1.0%
]
0.98%
225,15593.5%
[
1.0%
-
1.5%
]
1.06%
216,52394.4%
[
1.0%
-
1.5%
]
1.18%
72,35195.3%
[
1.0%
-
1.5%
]
1.31%
45,52092.3%
[
1.0%
-
1.5%
]
1.45%
23,31790.0%
[
1.5%
-
2.0%
]
1.59%
6,28795.2%
[
1.5%
-
2.0%
]
1.66%
11,87793.6%
[
1.5%
-
2.0%
]
1.74%
36,20895.4%
[
1.5%
-
2.0%
]
1.87%
18,31185.4%
[
2.0%
-
2.5%
]
2.06%
7,65495.5%
[
2.0%
-
2.5%
]
2.19%
10,58896.8%
[
2.0%
-
2.5%
]
2.27%
13,81490.5%
[
2.0%
-
2.5%
]
2.42%
9,69197.6%
[
2.5%
-
3.0%
]
2.62%
21,00097.4%
[
2.5%
-
3.0%
]
2.71%
8,65897.2%
[
2.5%
-
3.0%
]
2.98%
8,65098.1%
[
3.0%
-
3.5%
]
3.11%
5,08893.5%
[
3.0%
-
3.5%
]
3.25%
1,786100.0%
[
3.5%
-
4.0%
]
3.62%
525100.0%
[
4.5%
-
5.0%
]
4.87%
34976.0%
[
6.0%
-
6.5%
]
6.15%
439100.0%
[
8.5%
-
9.0%
]
8.82%
68100.0%
[
20.0%
-
20.5%
]
20.41%
49100.0%