Immigrants from Saudi Arabia 3 or more Vehicles in Household
COMPARE
Immigrants from Saudi Arabia
Select to Compare
3 or more Vehicles in Household
Immigrants from Saudi Arabia 3 or more Vehicles in Household
18.0%
3+ VEHICLES AVAILABLE
1.7/ 100
METRIC RATING
249th/ 347
METRIC RANK
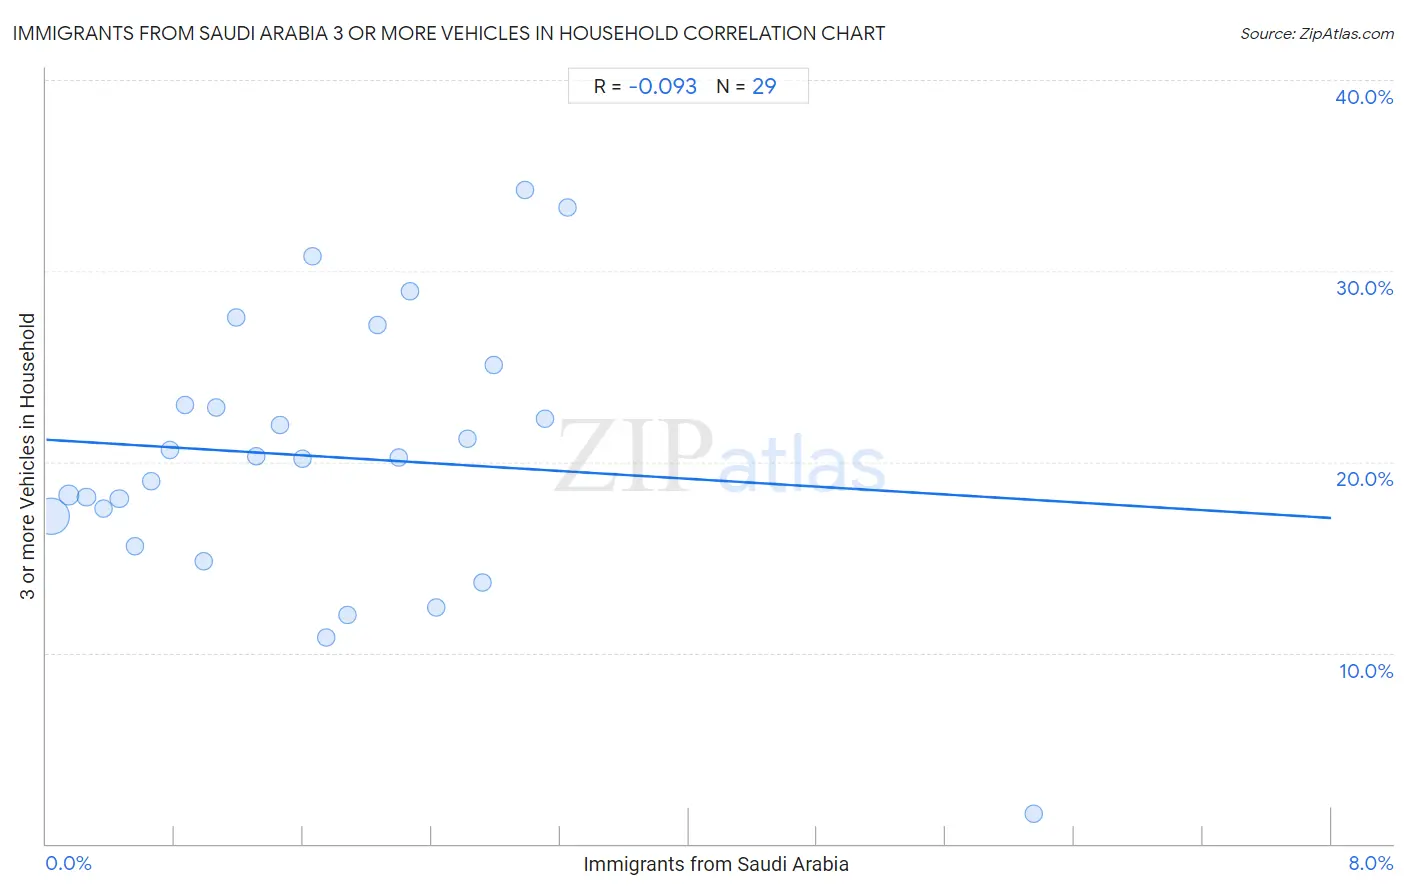
Immigrants from Saudi Arabia 3 or more Vehicles in Household Correlation Chart
The statistical analysis conducted on geographies consisting of 164,148,473 people shows a slight negative correlation between the proportion of Immigrants from Saudi Arabia and percentage of households with 3 or more vehicles available in the United States with a correlation coefficient (R) of -0.093 and weighted average of 18.0%. On average, for every 1% (one percent) increase in Immigrants from Saudi Arabia within a typical geography, there is a decrease of 0.51% in percentage of households with 3 or more vehicles available.
It is essential to understand that the correlation between the percentage of Immigrants from Saudi Arabia and percentage of households with 3 or more vehicles available does not imply a direct cause-and-effect relationship. It remains uncertain whether the presence of Immigrants from Saudi Arabia influences an upward or downward trend in the level of percentage of households with 3 or more vehicles available within an area, or if Immigrants from Saudi Arabia simply ended up residing in those areas with higher or lower levels of percentage of households with 3 or more vehicles available due to other factors.
Demographics Similar to Immigrants from Saudi Arabia by 3 or more Vehicles in Household
In terms of 3 or more vehicles in household, the demographic groups most similar to Immigrants from Saudi Arabia are Venezuelan (18.0%, a difference of 0.020%), Immigrants from Eastern Africa (18.0%, a difference of 0.060%), Carpatho Rusyn (18.0%, a difference of 0.19%), Alsatian (18.0%, a difference of 0.22%), and Immigrants from Australia (18.1%, a difference of 0.35%).
| Demographics | Rating | Rank | 3 or more Vehicles in Household |
| Hopi | 2.5 /100 | #242 | Tragic 18.2% |
| Immigrants from Europe | 2.4 /100 | #243 | Tragic 18.1% |
| Mongolians | 2.3 /100 | #244 | Tragic 18.1% |
| Immigrants from Belize | 2.1 /100 | #245 | Tragic 18.1% |
| Immigrants from Australia | 2.0 /100 | #246 | Tragic 18.1% |
| Carpatho Rusyns | 1.9 /100 | #247 | Tragic 18.0% |
| Immigrants from Eastern Africa | 1.8 /100 | #248 | Tragic 18.0% |
| Immigrants from Saudi Arabia | 1.7 /100 | #249 | Tragic 18.0% |
| Venezuelans | 1.7 /100 | #250 | Tragic 18.0% |
| Alsatians | 1.5 /100 | #251 | Tragic 18.0% |
| Immigrants from Southern Europe | 1.4 /100 | #252 | Tragic 17.9% |
| Immigrants from Ethiopia | 1.3 /100 | #253 | Tragic 17.9% |
| Ethiopians | 1.2 /100 | #254 | Tragic 17.9% |
| Immigrants from Turkey | 1.2 /100 | #255 | Tragic 17.9% |
| Sub-Saharan Africans | 1.1 /100 | #256 | Tragic 17.9% |
Immigrants from Saudi Arabia 3 or more Vehicles in Household Correlation Summary
| Measurement | Immigrants from Saudi Arabia Data | 3 or more Vehicles in Household Data |
| Minimum | 0.033% | 1.5% |
| Maximum | 6.2% | 34.2% |
| Range | 6.1% | 32.7% |
| Mean | 1.7% | 20.3% |
| Median | 1.6% | 20.2% |
| Interquartile 25% (IQ1) | 0.72% | 16.4% |
| Interquartile 75% (IQ3) | 2.5% | 24.0% |
| Interquartile Range (IQR) | 1.8% | 7.7% |
| Standard Deviation (Sample) | 1.3% | 7.1% |
| Standard Deviation (Population) | 1.3% | 6.9% |
Correlation Details
| Immigrants from Saudi Arabia Percentile | Sample Size | 3 or more Vehicles in Household |
[ 0.0% - 0.5% ] 0.033% | 134,776,333 | 17.1% |
[ 0.0% - 0.5% ] 0.14% | 17,145,593 | 18.3% |
[ 0.0% - 0.5% ] 0.25% | 5,657,969 | 18.2% |
[ 0.0% - 0.5% ] 0.35% | 2,771,038 | 17.5% |
[ 0.0% - 0.5% ] 0.45% | 1,338,966 | 18.1% |
[ 0.5% - 1.0% ] 0.55% | 611,021 | 15.6% |
[ 0.5% - 1.0% ] 0.66% | 423,125 | 19.0% |
[ 0.5% - 1.0% ] 0.77% | 509,278 | 20.6% |
[ 0.5% - 1.0% ] 0.87% | 171,386 | 23.0% |
[ 0.5% - 1.0% ] 0.98% | 225,155 | 14.8% |
[ 1.0% - 1.5% ] 1.06% | 216,523 | 22.9% |
[ 1.0% - 1.5% ] 1.18% | 72,351 | 27.5% |
[ 1.0% - 1.5% ] 1.31% | 45,520 | 20.3% |
[ 1.0% - 1.5% ] 1.45% | 23,317 | 21.9% |
[ 1.5% - 2.0% ] 1.60% | 5,450 | 20.2% |
[ 1.5% - 2.0% ] 1.66% | 11,877 | 30.7% |
[ 1.5% - 2.0% ] 1.74% | 35,130 | 10.8% |
[ 1.5% - 2.0% ] 1.87% | 17,090 | 11.9% |
[ 2.0% - 2.5% ] 2.06% | 7,654 | 27.1% |
[ 2.0% - 2.5% ] 2.19% | 10,588 | 20.2% |
[ 2.0% - 2.5% ] 2.27% | 13,814 | 28.9% |
[ 2.0% - 2.5% ] 2.42% | 9,691 | 12.4% |
[ 2.5% - 3.0% ] 2.62% | 21,000 | 21.2% |
[ 2.5% - 3.0% ] 2.71% | 8,658 | 13.7% |
[ 2.5% - 3.0% ] 2.79% | 3,983 | 25.1% |
[ 2.5% - 3.0% ] 2.98% | 8,650 | 34.2% |
[ 3.0% - 3.5% ] 3.11% | 5,088 | 22.3% |
[ 3.0% - 3.5% ] 3.25% | 1,786 | 33.3% |
[ 6.0% - 6.5% ] 6.15% | 439 | 1.5% |