Immigrants from Korea vs Colombian Self-Care Disability

COMPARE

Immigrants from Korea
Race
Ancestry
AfghanAfricanAlaska NativeAlaskan AthabascanAlbanianAleutAlsatianAmericanApacheArabArapahoArgentineanArmenianAssyrian/Chaldean/SyriacAustralianAustrianBahamianBangladeshiBarbadianBasqueBelgianBelizeanBermudanBhutaneseBlackfeetBolivianBrazilianBritishBritish West IndianBulgarianBurmeseCajunCambodianCanadianCape VerdeanCarpatho RusynCelticCentral AmericanCentral American IndianCherokeeCheyenneChickasawChileanChineseChippewaChoctawColvilleComancheCosta RicanCreeCreekCroatianCrowCubanCypriotCzechCzechoslovakianDanishDelawareDominicanDutchDutch West IndianEastern EuropeanEcuadorianEgyptianEnglishEstonianEthiopianEuropeanFijianFilipinoFinnishFrenchFrench American IndianFrench CanadianGermanGerman RussianGhanaianGreekGuamanian/ChamorroGuatemalanGuyaneseHaitianHmongHonduranHopiHoumaHungarianIcelanderIndian (Asian)IndonesianInupiatIranianIraqiIrishIroquoisIsraeliItalianJamaicanJapaneseJordanianKenyanKiowaKoreanLaotianLatvianLebaneseLiberianLithuanianLumbeeLuxembourgerMacedonianMalaysianMalteseMarshalleseMenomineeMexicanMexican American IndianMongolianMoroccanNative HawaiianNavajoNepaleseNew ZealanderNicaraguanNigerianNorthern EuropeanNorwegianOkinawanOsageOttawaPaiutePakistaniPalestinianPanamanianParaguayanPennsylvania GermanPeruvianPimaPolishPortuguesePotawatomiPuebloPuerto RicanPuget Sound SalishRomanianRussianSalvadoranSamoanScandinavianScotch-IrishScottishSeminoleSenegaleseSerbianShoshoneSierra LeoneanSiouxSlavicSlovakSloveneSomaliSouth AfricanSouth AmericanSouth American IndianSoviet UnionSpaniardSpanishSpanish AmericanSpanish American IndianSri LankanSubsaharan AfricanSudaneseSwedishSwissSyrianTaiwaneseThaiTlingit-HaidaTohono O'OdhamTonganTrinidadian and TobagonianTsimshianTurkishU.S. Virgin IslanderUgandanUkrainianUruguayanUteVenezuelanVietnameseWelshWest IndianYakamaYaquiYugoslavianYumanYup'ikZimbabwean
Immigration
NonimmigrantsImmigrantsAfghanistanAfricaAlbaniaArgentinaArmeniaAsiaAustraliaAustriaBahamasBangladeshBarbadosBelarusBelgiumBelizeBoliviaBosnia and HerzegovinaBrazilBulgariaBurma/MyanmarCabo VerdeCambodiaCameroonCanadaCaribbeanCentral AmericaChileChinaColombiaCongoCosta RicaCroatiaCubaCzechoslovakiaDenmarkDominicaDominican RepublicEastern AfricaEastern AsiaEastern EuropeEcuadorEgyptEl SalvadorEnglandEritreaEthiopiaEuropeFijiFranceGermanyGhanaGreeceGrenadaGuatemalaGuyanaHaitiHondurasHong KongHungaryIndiaIndonesiaIranIraqIrelandIsraelItalyJamaicaJapanJordanKazakhstanKenyaKoreaKuwaitLaosLatin AmericaLatviaLebanonLiberiaLithuaniaMalaysiaMexicoMicronesiaMiddle AfricaMoldovaMoroccoNepalNetherlandsNicaraguaNigeriaNorth AmericaNorth MacedoniaNorthern AfricaNorthern EuropeNorwayOceaniaPakistanPanamaPeruPhilippinesPolandPortugalRomaniaRussiaSaudi ArabiaScotlandSenegalSerbiaSierra LeoneSingaporeSomaliaSouth AfricaSouth AmericaSouth Central AsiaSouth Eastern AsiaSouthern EuropeSpainSri LankaSt. Vincent and the GrenadinesSudanSwedenSwitzerlandSyriaTaiwanThailandTrinidad and TobagoTurkeyUgandaUkraineUruguayUzbekistanVenezuelaVietnamWest IndiesWestern AfricaWestern AsiaWestern EuropeYemenZaireZimbabweAzores
Colombian
Race
Ancestry
AfghanAfricanAlaska NativeAlaskan AthabascanAlbanianAleutAlsatianAmericanApacheArabArapahoArgentineanArmenianAssyrian/Chaldean/SyriacAustralianAustrianBahamianBangladeshiBarbadianBasqueBelgianBelizeanBermudanBhutaneseBlackfeetBolivianBrazilianBritishBritish West IndianBulgarianBurmeseCajunCambodianCanadianCape VerdeanCarpatho RusynCelticCentral AmericanCentral American IndianCherokeeCheyenneChickasawChileanChineseChippewaChoctawColombianColvilleComancheCosta RicanCreeCreekCroatianCrowCubanCypriotCzechCzechoslovakianDanishDelawareDominicanDutchDutch West IndianEastern EuropeanEcuadorianEgyptianEnglishEstonianEthiopianEuropeanFijianFilipinoFinnishFrenchFrench American IndianFrench CanadianGermanGerman RussianGhanaianGreekGuamanian/ChamorroGuatemalanGuyaneseHaitianHmongHonduranHopiHoumaHungarianIcelanderIndian (Asian)IndonesianInupiatIranianIraqiIrishIroquoisIsraeliItalianJamaicanJapaneseJordanianKenyanKiowaKoreanLaotianLatvianLebaneseLiberianLithuanianLumbeeLuxembourgerMacedonianMalaysianMalteseMarshalleseMenomineeMexicanMexican American IndianMongolianMoroccanNative HawaiianNavajoNepaleseNew ZealanderNicaraguanNigerianNorthern EuropeanNorwegianOkinawanOsageOttawaPaiutePakistaniPalestinianPanamanianParaguayanPennsylvania GermanPeruvianPimaPolishPortuguesePotawatomiPuebloPuerto RicanPuget Sound SalishRomanianRussianSalvadoranSamoanScandinavianScotch-IrishScottishSeminoleSenegaleseSerbianShoshoneSierra LeoneanSiouxSlavicSlovakSloveneSomaliSouth AfricanSouth AmericanSouth American IndianSoviet UnionSpaniardSpanishSpanish AmericanSpanish American IndianSri LankanSubsaharan AfricanSudaneseSwedishSwissSyrianTaiwaneseThaiTlingit-HaidaTohono O'OdhamTonganTrinidadian and TobagonianTsimshianTurkishU.S. Virgin IslanderUgandanUkrainianUruguayanUteVenezuelanVietnameseWelshWest IndianYakamaYaquiYugoslavianYumanYup'ikZimbabwean
Immigration
NonimmigrantsImmigrantsAfghanistanAfricaAlbaniaArgentinaArmeniaAsiaAustraliaAustriaBahamasBangladeshBarbadosBelarusBelgiumBelizeBoliviaBosnia and HerzegovinaBrazilBulgariaBurma/MyanmarCabo VerdeCambodiaCameroonCanadaCaribbeanCentral AmericaChileChinaColombiaCongoCosta RicaCroatiaCubaCzechoslovakiaDenmarkDominicaDominican RepublicEastern AfricaEastern AsiaEastern EuropeEcuadorEgyptEl SalvadorEnglandEritreaEthiopiaEuropeFijiFranceGermanyGhanaGreeceGrenadaGuatemalaGuyanaHaitiHondurasHong KongHungaryIndiaIndonesiaIranIraqIrelandIsraelItalyJamaicaJapanJordanKazakhstanKenyaKuwaitLaosLatin AmericaLatviaLebanonLiberiaLithuaniaMalaysiaMexicoMicronesiaMiddle AfricaMoldovaMoroccoNepalNetherlandsNicaraguaNigeriaNorth AmericaNorth MacedoniaNorthern AfricaNorthern EuropeNorwayOceaniaPakistanPanamaPeruPhilippinesPolandPortugalRomaniaRussiaSaudi ArabiaScotlandSenegalSerbiaSierra LeoneSingaporeSomaliaSouth AfricaSouth AmericaSouth Central AsiaSouth Eastern AsiaSouthern EuropeSpainSri LankaSt. Vincent and the GrenadinesSudanSwedenSwitzerlandSyriaTaiwanThailandTrinidad and TobagoTurkeyUgandaUkraineUruguayUzbekistanVenezuelaVietnamWest IndiesWestern AfricaWestern AsiaWestern EuropeYemenZaireZimbabweAzores
Self-Care Disability
Income
Poverty
Unemployment
Labor Participation
Family Structure
Vehicle Availability
Education Level
Disability

Self-Care Disability Comparison

Immigrants from Korea

Colombians

Exceptional
Excellent
2.3%
SELF-CARE DISABILITY
99.9/ 100
METRIC RATING
33rd/ 347
METRIC RANK
2.4%
SELF-CARE DISABILITY
89.7/ 100
METRIC RATING
127th/ 347
METRIC RANK

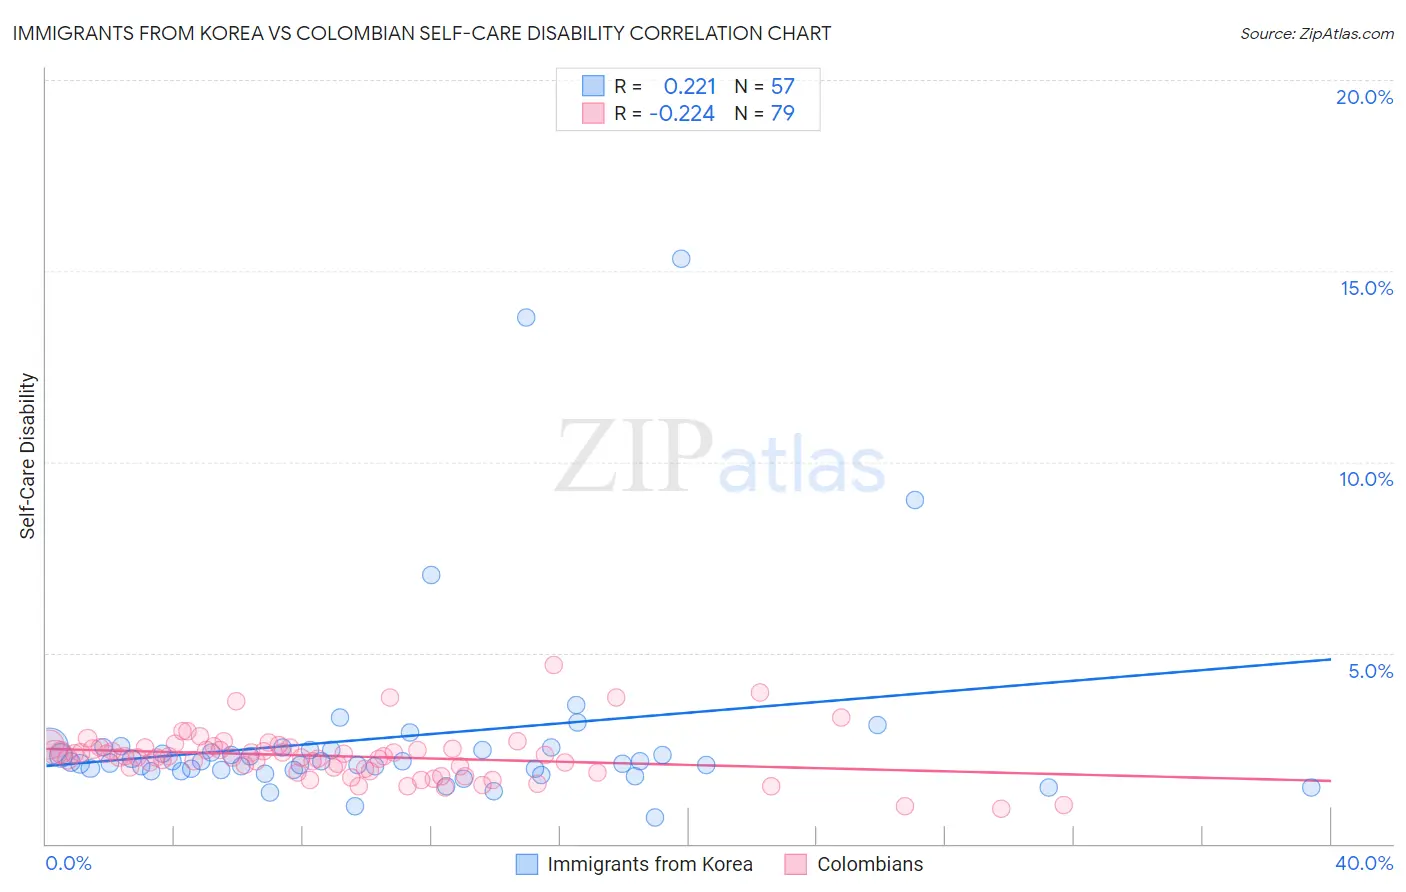
Immigrants from Korea vs Colombian Self-Care Disability Correlation Chart

The statistical analysis conducted on geographies consisting of 415,570,089 people shows a weak positive correlation between the proportion of Immigrants from Korea and percentage of population with self-care disability in the United States with a correlation coefficient (R) of 0.221 and weighted average of 2.3%. Similarly, the statistical analysis conducted on geographies consisting of 419,041,543 people shows a weak negative correlation between the proportion of Colombians and percentage of population with self-care disability in the United States with a correlation coefficient (R) of -0.224 and weighted average of 2.4%, a difference of 6.1%.
Immigrants from Korea vs Colombian Self-Care Disability

Self-Care Disability Correlation Summary

MeasurementImmigrants from KoreaColombian
Minimum0.68%0.93%
Maximum15.3%4.7%
Range14.6%3.8%
Mean2.8%2.3%
Median2.1%2.3%
Interquartile 25% (IQ1)1.9%2.0%
Interquartile 75% (IQ3)2.5%2.5%
Interquartile Range (IQR)0.57%0.55%
Standard Deviation (Sample)2.6%0.63%
Standard Deviation (Population)2.6%0.63%

Similar Demographics by Self-Care Disability

Demographics Similar to Immigrants from Korea by Self-Care Disability

In terms of self-care disability, the demographic groups most similar to Immigrants from Korea are Immigrants from Turkey (2.3%, a difference of 0.060%), Immigrants from Australia (2.3%, a difference of 0.12%), Immigrants from Lithuania (2.3%, a difference of 0.13%), Burmese (2.3%, a difference of 0.23%), and Danish (2.3%, a difference of 0.30%).
DemographicsRating | RankSelf-Care Disability
Immigrants | Sri Lanka
99.9
/100
|
#26
Exceptional
2.2%
Venezuelans
99.9
/100
|
#27
Exceptional
2.2%
Inupiat
99.9
/100
|
#28
Exceptional
2.2%
Immigrants | Zimbabwe
99.9
/100
|
#29
Exceptional
2.3%
Paraguayans
99.9
/100
|
#30
Exceptional
2.3%
Danes
99.9
/100
|
#31
Exceptional
2.3%
Burmese
99.9
/100
|
#32
Exceptional
2.3%
Immigrants | Korea
99.9
/100
|
#33
Exceptional
2.3%
Immigrants | Turkey
99.9
/100
|
#34
Exceptional
2.3%
Immigrants | Australia
99.9
/100
|
#35
Exceptional
2.3%
Immigrants | Lithuania
99.9
/100
|
#36
Exceptional
2.3%
Immigrants | Sweden
99.9
/100
|
#37
Exceptional
2.3%
Immigrants | Eastern Africa
99.9
/100
|
#38
Exceptional
2.3%
Immigrants | Bulgaria
99.8
/100
|
#39
Exceptional
2.3%
Iranians
99.8
/100
|
#40
Exceptional
2.3%

Demographics Similar to Colombians by Self-Care Disability

In terms of self-care disability, the demographic groups most similar to Colombians are Immigrants from Hungary (2.4%, a difference of 0.010%), Hmong (2.4%, a difference of 0.030%), Immigrants from Romania (2.4%, a difference of 0.060%), Immigrants from Morocco (2.4%, a difference of 0.070%), and Immigrants from North America (2.4%, a difference of 0.070%).
DemographicsRating | RankSelf-Care Disability
Uruguayans
91.5
/100
|
#120
Exceptional
2.4%
Peruvians
91.3
/100
|
#121
Exceptional
2.4%
Belgians
90.9
/100
|
#122
Exceptional
2.4%
Immigrants | Nigeria
90.3
/100
|
#123
Exceptional
2.4%
Immigrants | Morocco
90.2
/100
|
#124
Exceptional
2.4%
Immigrants | North America
90.2
/100
|
#124
Exceptional
2.4%
Hmong
89.9
/100
|
#126
Excellent
2.4%
Colombians
89.7
/100
|
#127
Excellent
2.4%
Immigrants | Hungary
89.6
/100
|
#128
Excellent
2.4%
Immigrants | Romania
89.3
/100
|
#129
Excellent
2.4%
Immigrants | Austria
89.0
/100
|
#130
Excellent
2.4%
Poles
88.9
/100
|
#131
Excellent
2.4%
Immigrants | South America
88.8
/100
|
#132
Excellent
2.4%
Immigrants | Colombia
88.5
/100
|
#133
Excellent
2.4%
Russians
88.2
/100
|
#134
Excellent
2.4%