Greek Receiving Food Stamps
COMPARE
Greek
Select to Compare
Receiving Food Stamps
Greek Receiving Food Stamps
9.7%
PUBLIC INCOME | FOOD STAMPS
99.3/ 100
METRIC RATING
57th/ 347
METRIC RANK
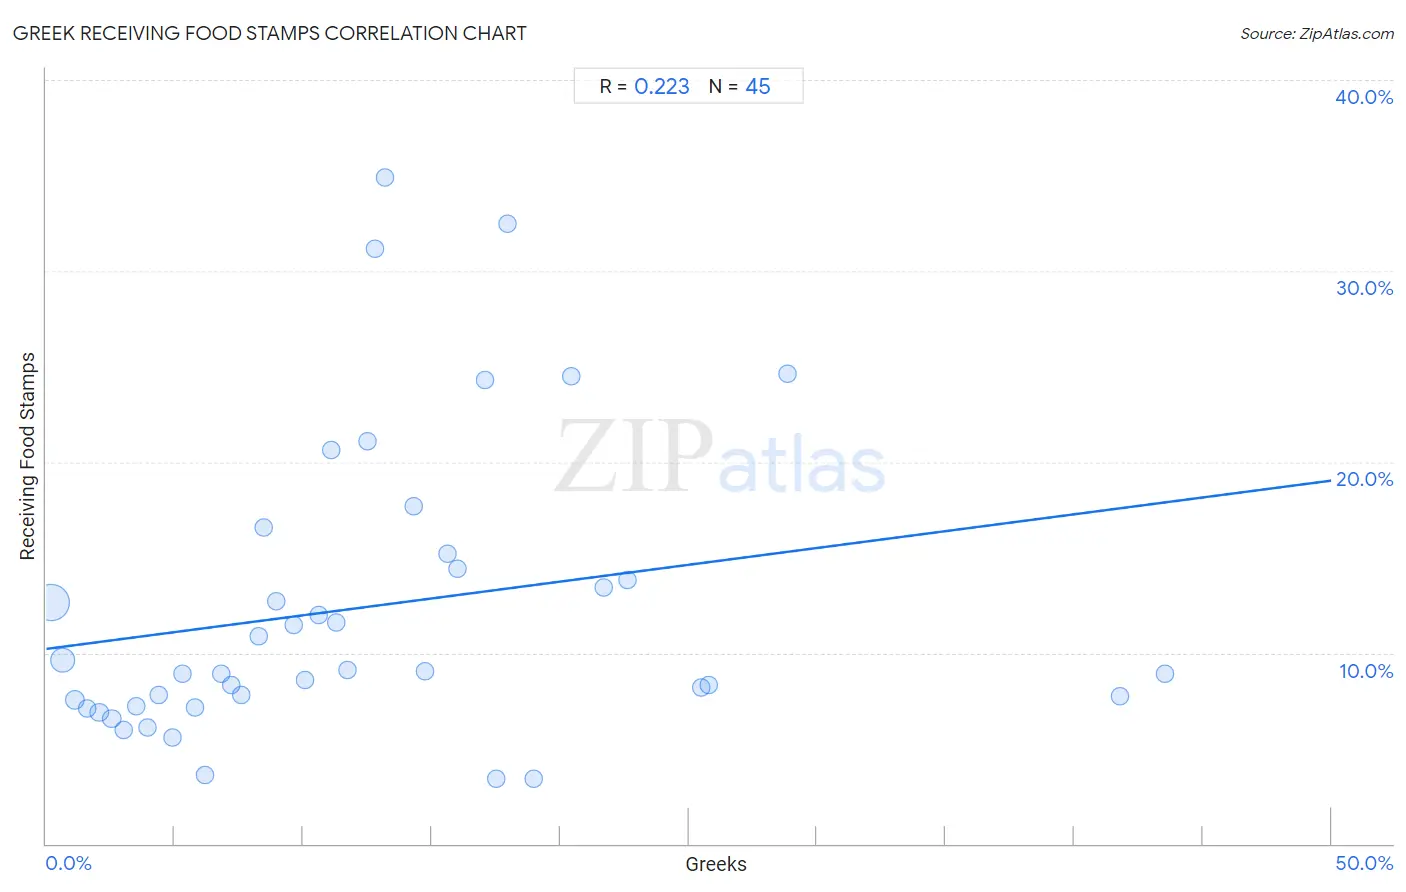
Greek Receiving Food Stamps Correlation Chart
The statistical analysis conducted on geographies consisting of 480,606,207 people shows a weak positive correlation between the proportion of Greeks and percentage of population receiving government assistance and/or food stamps in the United States with a correlation coefficient (R) of 0.223 and weighted average of 9.7%. On average, for every 1% (one percent) increase in Greeks within a typical geography, there is an increase of 0.18% in percentage of population receiving government assistance and/or food stamps.
It is essential to understand that the correlation between the percentage of Greeks and percentage of population receiving government assistance and/or food stamps does not imply a direct cause-and-effect relationship. It remains uncertain whether the presence of Greeks influences an upward or downward trend in the level of percentage of population receiving government assistance and/or food stamps within an area, or if Greeks simply ended up residing in those areas with higher or lower levels of percentage of population receiving government assistance and/or food stamps due to other factors.
Demographics Similar to Greeks by Receiving Food Stamps
In terms of receiving food stamps, the demographic groups most similar to Greeks are Scandinavian (9.7%, a difference of 0.060%), British (9.7%, a difference of 0.090%), Immigrants from Canada (9.7%, a difference of 0.11%), German (9.7%, a difference of 0.19%), and Immigrants from Switzerland (9.7%, a difference of 0.29%).
| Demographics | Rating | Rank | Receiving Food Stamps |
| Lithuanians | 99.4 /100 | #50 | Exceptional 9.7% |
| Asians | 99.3 /100 | #51 | Exceptional 9.7% |
| Immigrants from South Africa | 99.3 /100 | #52 | Exceptional 9.7% |
| Tongans | 99.3 /100 | #53 | Exceptional 9.7% |
| Swiss | 99.3 /100 | #54 | Exceptional 9.7% |
| Immigrants from Switzerland | 99.3 /100 | #55 | Exceptional 9.7% |
| Immigrants from Canada | 99.3 /100 | #56 | Exceptional 9.7% |
| Greeks | 99.3 /100 | #57 | Exceptional 9.7% |
| Scandinavians | 99.2 /100 | #58 | Exceptional 9.7% |
| British | 99.2 /100 | #59 | Exceptional 9.7% |
| Germans | 99.2 /100 | #60 | Exceptional 9.7% |
| English | 99.2 /100 | #61 | Exceptional 9.8% |
| Immigrants from Bulgaria | 99.2 /100 | #62 | Exceptional 9.8% |
| Chinese | 99.2 /100 | #63 | Exceptional 9.8% |
| Immigrants from North America | 99.2 /100 | #64 | Exceptional 9.8% |
Greek Receiving Food Stamps Correlation Summary
| Measurement | Greek Data | Receiving Food Stamps Data |
| Minimum | 0.21% | 3.4% |
| Maximum | 43.5% | 34.9% |
| Range | 43.3% | 31.5% |
| Mean | 12.4% | 12.4% |
| Median | 10.6% | 9.0% |
| Interquartile 25% (IQ1) | 5.1% | 7.4% |
| Interquartile 75% (IQ3) | 17.3% | 14.8% |
| Interquartile Range (IQR) | 12.2% | 7.4% |
| Standard Deviation (Sample) | 9.8% | 7.7% |
| Standard Deviation (Population) | 9.7% | 7.7% |
Correlation Details
| Greek Percentile | Sample Size | Receiving Food Stamps |
[ 0.0% - 0.5% ] 0.21% | 329,259,745 | 12.7% |
[ 0.5% - 1.0% ] 0.65% | 102,669,583 | 9.6% |
[ 1.0% - 1.5% ] 1.11% | 26,874,323 | 7.5% |
[ 1.5% - 2.0% ] 1.61% | 10,858,816 | 7.1% |
[ 2.0% - 2.5% ] 2.06% | 4,307,580 | 6.9% |
[ 2.5% - 3.0% ] 2.55% | 2,773,361 | 6.5% |
[ 2.5% - 3.0% ] 3.00% | 1,505,703 | 6.0% |
[ 3.0% - 3.5% ] 3.50% | 742,894 | 7.2% |
[ 3.5% - 4.0% ] 3.95% | 336,489 | 6.1% |
[ 4.0% - 4.5% ] 4.40% | 495,060 | 7.8% |
[ 4.5% - 5.0% ] 4.91% | 141,195 | 5.6% |
[ 5.0% - 5.5% ] 5.29% | 160,954 | 8.9% |
[ 5.5% - 6.0% ] 5.81% | 113,093 | 7.2% |
[ 6.0% - 6.5% ] 6.19% | 101,031 | 3.6% |
[ 6.5% - 7.0% ] 6.80% | 59,129 | 8.9% |
[ 7.0% - 7.5% ] 7.18% | 82,290 | 8.3% |
[ 7.5% - 8.0% ] 7.60% | 31,375 | 7.8% |
[ 8.0% - 8.5% ] 8.26% | 2,312 | 10.9% |
[ 8.0% - 8.5% ] 8.49% | 2,286 | 16.5% |
[ 8.5% - 9.0% ] 8.93% | 1,534 | 12.7% |
[ 9.5% - 10.0% ] 9.64% | 4,141 | 11.5% |
[ 10.0% - 10.5% ] 10.08% | 4,933 | 8.6% |
[ 10.5% - 11.0% ] 10.59% | 255 | 12.0% |
[ 11.0% - 11.5% ] 11.11% | 12,261 | 20.6% |
[ 11.0% - 11.5% ] 11.29% | 47,509 | 11.6% |
[ 11.5% - 12.0% ] 11.72% | 2,612 | 9.1% |
[ 12.0% - 12.5% ] 12.50% | 344 | 21.1% |
[ 12.5% - 13.0% ] 12.79% | 1,267 | 31.2% |
[ 13.0% - 13.5% ] 13.17% | 463 | 34.9% |
[ 14.0% - 14.5% ] 14.29% | 525 | 17.7% |
[ 14.5% - 15.0% ] 14.72% | 3,588 | 9.0% |
[ 15.5% - 16.0% ] 15.62% | 4,226 | 15.2% |
[ 16.0% - 16.5% ] 16.01% | 1,443 | 14.4% |
[ 17.0% - 17.5% ] 17.07% | 943 | 24.3% |
[ 17.5% - 18.0% ] 17.53% | 485 | 3.4% |
[ 17.5% - 18.0% ] 17.95% | 234 | 32.5% |
[ 18.5% - 19.0% ] 18.95% | 438 | 3.4% |
[ 20.0% - 20.5% ] 20.43% | 421 | 24.5% |
[ 21.5% - 22.0% ] 21.68% | 143 | 13.4% |
[ 22.5% - 23.0% ] 22.63% | 137 | 13.8% |
[ 25.5% - 26.0% ] 25.51% | 396 | 8.2% |
[ 25.5% - 26.0% ] 25.77% | 392 | 8.3% |
[ 28.5% - 29.0% ] 28.83% | 111 | 24.6% |
[ 41.5% - 42.0% ] 41.77% | 79 | 7.7% |
[ 43.5% - 44.0% ] 43.52% | 108 | 8.9% |