Greek College, Under 1 year
COMPARE
Greek
Select to Compare
College, Under 1 year
Greek College, Under 1 year
68.5%
COLLEGE, UNDER 1 YEAR
98.6/ 100
METRIC RATING
79th/ 347
METRIC RANK
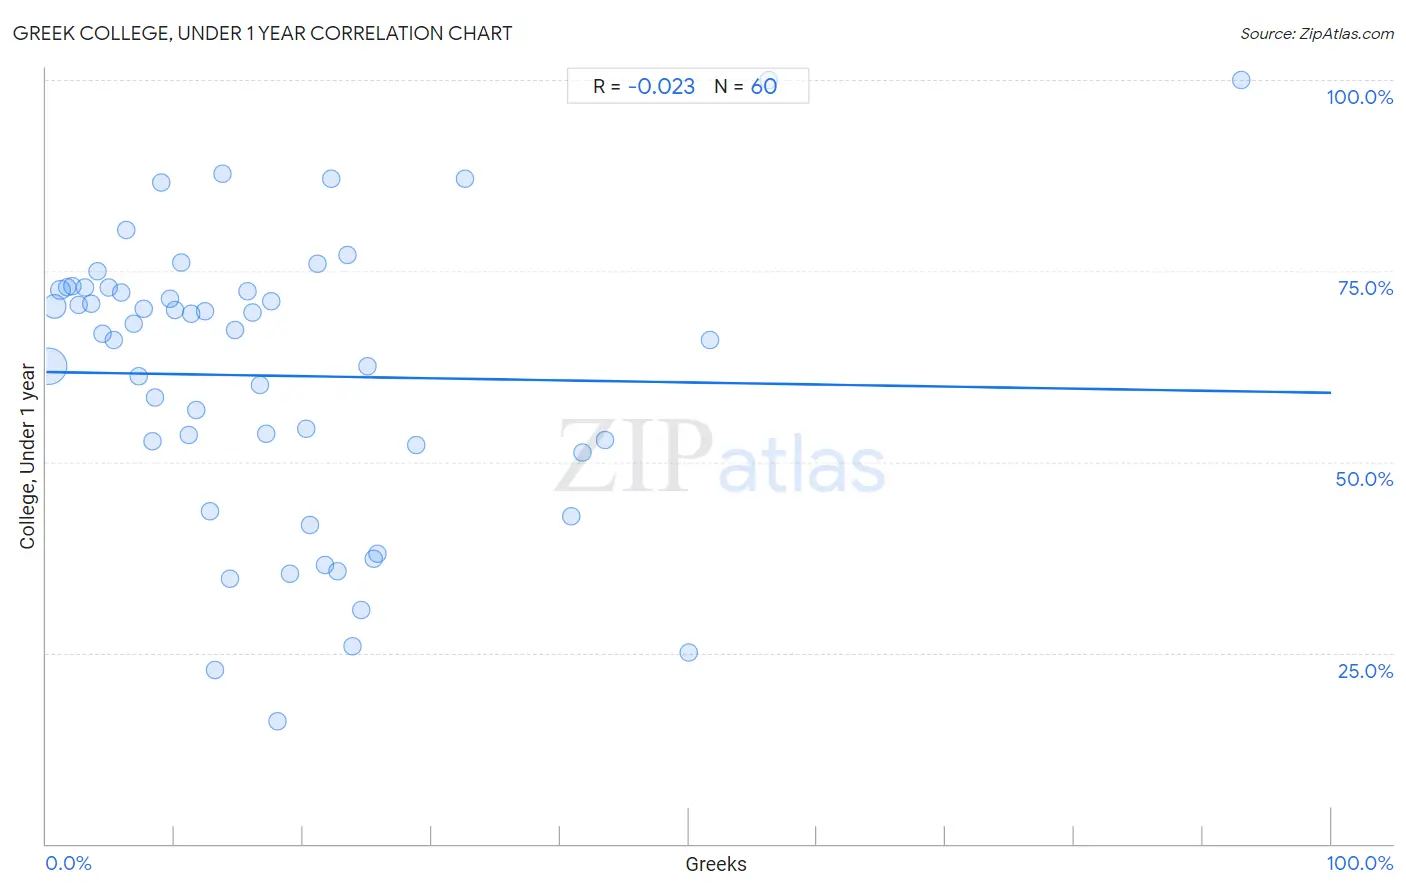
Greek College, Under 1 year Correlation Chart
The statistical analysis conducted on geographies consisting of 482,772,092 people shows no correlation between the proportion of Greeks and percentage of population with at least college, under 1 year education in the United States with a correlation coefficient (R) of -0.023 and weighted average of 68.5%. On average, for every 1% (one percent) increase in Greeks within a typical geography, there is a decrease of 0.027% in percentage of population with at least college, under 1 year education.
It is essential to understand that the correlation between the percentage of Greeks and percentage of population with at least college, under 1 year education does not imply a direct cause-and-effect relationship. It remains uncertain whether the presence of Greeks influences an upward or downward trend in the level of percentage of population with at least college, under 1 year education within an area, or if Greeks simply ended up residing in those areas with higher or lower levels of percentage of population with at least college, under 1 year education due to other factors.
Demographics Similar to Greeks by College, Under 1 year
In terms of college, under 1 year, the demographic groups most similar to Greeks are Danish (68.5%, a difference of 0.010%), British (68.5%, a difference of 0.020%), Immigrants from Spain (68.4%, a difference of 0.030%), Immigrants from Western Europe (68.5%, a difference of 0.070%), and Laotian (68.5%, a difference of 0.070%).
| Demographics | Rating | Rank | College, Under 1 year |
| Bolivians | 99.0 /100 | #72 | Exceptional 68.7% |
| Immigrants from England | 99.0 /100 | #73 | Exceptional 68.7% |
| Swedes | 98.9 /100 | #74 | Exceptional 68.7% |
| Immigrants from Western Europe | 98.6 /100 | #75 | Exceptional 68.5% |
| Laotians | 98.6 /100 | #76 | Exceptional 68.5% |
| British | 98.6 /100 | #77 | Exceptional 68.5% |
| Danes | 98.6 /100 | #78 | Exceptional 68.5% |
| Greeks | 98.6 /100 | #79 | Exceptional 68.5% |
| Immigrants from Spain | 98.5 /100 | #80 | Exceptional 68.4% |
| Immigrants from Greece | 98.5 /100 | #81 | Exceptional 68.4% |
| Norwegians | 98.4 /100 | #82 | Exceptional 68.4% |
| Argentineans | 98.4 /100 | #83 | Exceptional 68.4% |
| Immigrants from Hungary | 98.3 /100 | #84 | Exceptional 68.3% |
| Egyptians | 98.3 /100 | #85 | Exceptional 68.3% |
| Immigrants from Lebanon | 98.3 /100 | #86 | Exceptional 68.3% |
Greek College, Under 1 year Correlation Summary
| Measurement | Greek Data | College, Under 1 year Data |
| Minimum | 0.21% | 16.1% |
| Maximum | 93.0% | 100.0% |
| Range | 92.8% | 83.9% |
| Mean | 17.9% | 61.3% |
| Median | 14.0% | 67.1% |
| Interquartile 25% (IQ1) | 7.0% | 51.7% |
| Interquartile 75% (IQ3) | 23.0% | 72.6% |
| Interquartile Range (IQR) | 16.0% | 21.0% |
| Standard Deviation (Sample) | 16.4% | 18.9% |
| Standard Deviation (Population) | 16.2% | 18.8% |
Correlation Details
| Greek Percentile | Sample Size | College, Under 1 year |
[ 0.0% - 0.5% ] 0.21% | 330,121,963 | 62.5% |
[ 0.5% - 1.0% ] 0.65% | 103,172,215 | 70.4% |
[ 1.0% - 1.5% ] 1.11% | 27,158,915 | 72.5% |
[ 1.5% - 2.0% ] 1.61% | 11,023,505 | 72.9% |
[ 2.0% - 2.5% ] 2.06% | 4,394,246 | 73.1% |
[ 2.5% - 3.0% ] 2.55% | 2,866,739 | 70.6% |
[ 2.5% - 3.0% ] 3.00% | 1,536,366 | 72.9% |
[ 3.0% - 3.5% ] 3.50% | 788,701 | 70.6% |
[ 3.5% - 4.0% ] 3.95% | 350,815 | 74.9% |
[ 4.0% - 4.5% ] 4.40% | 504,599 | 66.8% |
[ 4.5% - 5.0% ] 4.91% | 154,577 | 72.8% |
[ 5.0% - 5.5% ] 5.29% | 165,642 | 66.0% |
[ 5.5% - 6.0% ] 5.82% | 133,894 | 72.2% |
[ 6.0% - 6.5% ] 6.20% | 105,223 | 80.4% |
[ 6.5% - 7.0% ] 6.80% | 61,600 | 68.1% |
[ 7.0% - 7.5% ] 7.17% | 86,850 | 61.2% |
[ 7.5% - 8.0% ] 7.60% | 31,489 | 70.0% |
[ 8.0% - 8.5% ] 8.24% | 3,848 | 52.8% |
[ 8.0% - 8.5% ] 8.48% | 2,499 | 58.4% |
[ 8.5% - 9.0% ] 8.96% | 1,686 | 86.6% |
[ 9.5% - 10.0% ] 9.63% | 8,433 | 71.4% |
[ 10.0% - 10.5% ] 10.01% | 7,410 | 69.8% |
[ 10.5% - 11.0% ] 10.50% | 1,019 | 76.0% |
[ 11.0% - 11.5% ] 11.10% | 13,147 | 53.5% |
[ 11.0% - 11.5% ] 11.31% | 50,738 | 69.3% |
[ 11.5% - 12.0% ] 11.72% | 2,612 | 56.7% |
[ 12.0% - 12.5% ] 12.35% | 2,833 | 69.8% |
[ 12.5% - 13.0% ] 12.79% | 1,267 | 43.6% |
[ 13.0% - 13.5% ] 13.17% | 463 | 22.7% |
[ 13.5% - 14.0% ] 13.68% | 665 | 87.8% |
[ 14.0% - 14.5% ] 14.29% | 525 | 34.7% |
[ 14.5% - 15.0% ] 14.71% | 3,773 | 67.3% |
[ 15.5% - 16.0% ] 15.61% | 4,374 | 72.3% |
[ 16.0% - 16.5% ] 16.01% | 1,443 | 69.6% |
[ 16.5% - 17.0% ] 16.67% | 60 | 60.0% |
[ 17.0% - 17.5% ] 17.07% | 943 | 53.7% |
[ 17.5% - 18.0% ] 17.53% | 753 | 71.1% |
[ 17.5% - 18.0% ] 17.95% | 234 | 16.1% |
[ 18.5% - 19.0% ] 18.95% | 438 | 35.4% |
[ 20.0% - 20.5% ] 20.28% | 646 | 54.4% |
[ 20.0% - 20.5% ] 20.48% | 83 | 41.8% |
[ 21.0% - 21.5% ] 21.13% | 1,940 | 76.0% |
[ 21.5% - 22.0% ] 21.68% | 143 | 36.5% |
[ 22.0% - 22.5% ] 22.22% | 72 | 87.0% |
[ 22.5% - 23.0% ] 22.63% | 137 | 35.7% |
[ 23.0% - 23.5% ] 23.43% | 700 | 77.0% |
[ 23.5% - 24.0% ] 23.86% | 88 | 25.8% |
[ 24.0% - 24.5% ] 24.49% | 49 | 30.6% |
[ 25.0% - 25.5% ] 25.00% | 8 | 62.5% |
[ 25.5% - 26.0% ] 25.51% | 396 | 37.3% |
[ 25.5% - 26.0% ] 25.77% | 392 | 38.0% |
[ 28.5% - 29.0% ] 28.83% | 111 | 52.2% |
[ 32.5% - 33.0% ] 32.59% | 313 | 87.1% |
[ 40.5% - 41.0% ] 40.85% | 71 | 42.9% |
[ 41.5% - 42.0% ] 41.77% | 79 | 51.2% |
[ 43.5% - 44.0% ] 43.52% | 108 | 52.9% |
[ 50.0% - 50.5% ] 50.00% | 4 | 25.0% |
[ 51.5% - 52.0% ] 51.65% | 91 | 65.9% |
[ 56.0% - 56.5% ] 56.25% | 16 | 100.0% |
[ 93.0% - 93.5% ] 93.01% | 143 | 100.0% |