Greek Disability Age Under 5
COMPARE
Greek
Select to Compare
Disability Age Under 5
Greek Disability Age Under 5
1.5%
DISABILITY | AGE UNDER 5
0.0/ 100
METRIC RATING
276th/ 347
METRIC RANK
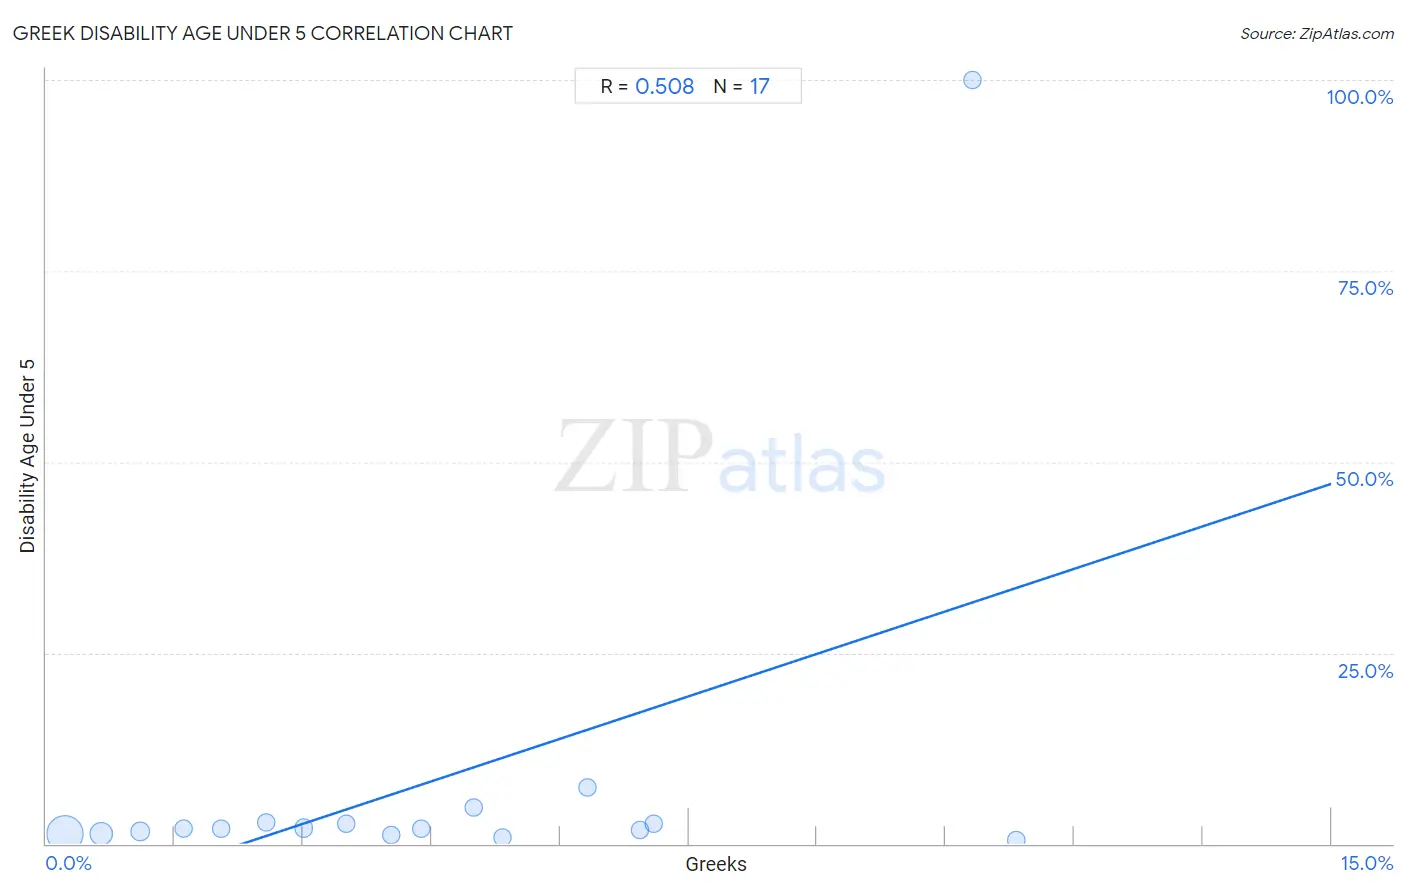
Greek Disability Age Under 5 Correlation Chart
The statistical analysis conducted on geographies consisting of 239,993,794 people shows a substantial positive correlation between the proportion of Greeks and percentage of population with a disability under the age of 5 in the United States with a correlation coefficient (R) of 0.508 and weighted average of 1.5%. On average, for every 1% (one percent) increase in Greeks within a typical geography, there is an increase of 3.7% in percentage of population with a disability under the age of 5.
It is essential to understand that the correlation between the percentage of Greeks and percentage of population with a disability under the age of 5 does not imply a direct cause-and-effect relationship. It remains uncertain whether the presence of Greeks influences an upward or downward trend in the level of percentage of population with a disability under the age of 5 within an area, or if Greeks simply ended up residing in those areas with higher or lower levels of percentage of population with a disability under the age of 5 due to other factors.
Demographics Similar to Greeks by Disability Age Under 5
In terms of disability age under 5, the demographic groups most similar to Greeks are Brazilian (1.5%, a difference of 0.57%), Iroquois (1.5%, a difference of 0.69%), Canadian (1.5%, a difference of 0.70%), Kiowa (1.5%, a difference of 0.78%), and Danish (1.5%, a difference of 0.79%).
| Demographics | Rating | Rank | Disability Age Under 5 |
| Austrians | 0.1 /100 | #269 | Tragic 1.4% |
| Immigrants from North America | 0.1 /100 | #270 | Tragic 1.4% |
| Immigrants from Canada | 0.1 /100 | #271 | Tragic 1.4% |
| Blacks/African Americans | 0.1 /100 | #272 | Tragic 1.4% |
| Alaskan Athabascans | 0.1 /100 | #273 | Tragic 1.5% |
| Iroquois | 0.0 /100 | #274 | Tragic 1.5% |
| Brazilians | 0.0 /100 | #275 | Tragic 1.5% |
| Greeks | 0.0 /100 | #276 | Tragic 1.5% |
| Canadians | 0.0 /100 | #277 | Tragic 1.5% |
| Kiowa | 0.0 /100 | #278 | Tragic 1.5% |
| Danes | 0.0 /100 | #279 | Tragic 1.5% |
| British | 0.0 /100 | #280 | Tragic 1.5% |
| Czechoslovakians | 0.0 /100 | #281 | Tragic 1.5% |
| Cheyenne | 0.0 /100 | #282 | Tragic 1.5% |
| Delaware | 0.0 /100 | #283 | Tragic 1.5% |
Greek Disability Age Under 5 Correlation Summary
| Measurement | Greek Data | Disability Age Under 5 Data |
| Minimum | 0.21% | 0.57% |
| Maximum | 11.3% | 100.0% |
| Range | 11.1% | 99.4% |
| Mean | 4.5% | 8.0% |
| Median | 4.0% | 2.0% |
| Interquartile 25% (IQ1) | 1.8% | 1.3% |
| Interquartile 75% (IQ3) | 6.6% | 2.7% |
| Interquartile Range (IQR) | 4.8% | 1.4% |
| Standard Deviation (Sample) | 3.3% | 23.8% |
| Standard Deviation (Population) | 3.2% | 23.0% |
Correlation Details
| Greek Percentile | Sample Size | Disability Age Under 5 |
[ 0.0% - 0.5% ] 0.21% | 178,494,417 | 1.3% |
[ 0.5% - 1.0% ] 0.64% | 47,216,335 | 1.3% |
[ 1.0% - 1.5% ] 1.10% | 8,287,196 | 1.6% |
[ 1.5% - 2.0% ] 1.61% | 3,019,587 | 2.0% |
[ 2.0% - 2.5% ] 2.04% | 1,016,862 | 2.0% |
[ 2.5% - 3.0% ] 2.56% | 867,772 | 2.8% |
[ 3.0% - 3.5% ] 3.01% | 383,895 | 2.0% |
[ 3.5% - 4.0% ] 3.50% | 265,543 | 2.6% |
[ 4.0% - 4.5% ] 4.02% | 45,243 | 1.2% |
[ 4.0% - 4.5% ] 4.38% | 198,369 | 2.0% |
[ 4.5% - 5.0% ] 4.99% | 20,901 | 4.8% |
[ 5.0% - 5.5% ] 5.32% | 80,974 | 0.89% |
[ 6.0% - 6.5% ] 6.32% | 2,041 | 7.4% |
[ 6.5% - 7.0% ] 6.94% | 27,076 | 1.9% |
[ 7.0% - 7.5% ] 7.09% | 28,281 | 2.5% |
[ 10.5% - 11.0% ] 10.81% | 546 | 100.0% |
[ 11.0% - 11.5% ] 11.32% | 38,756 | 0.57% |