Greek Married-couple Households
COMPARE
Greek
Select to Compare
Married-couple Households
Greek Married-couple Households
48.9%
MARRIED-COUPLE HOUSEHOLDS
99.7/ 100
METRIC RATING
38th/ 347
METRIC RANK
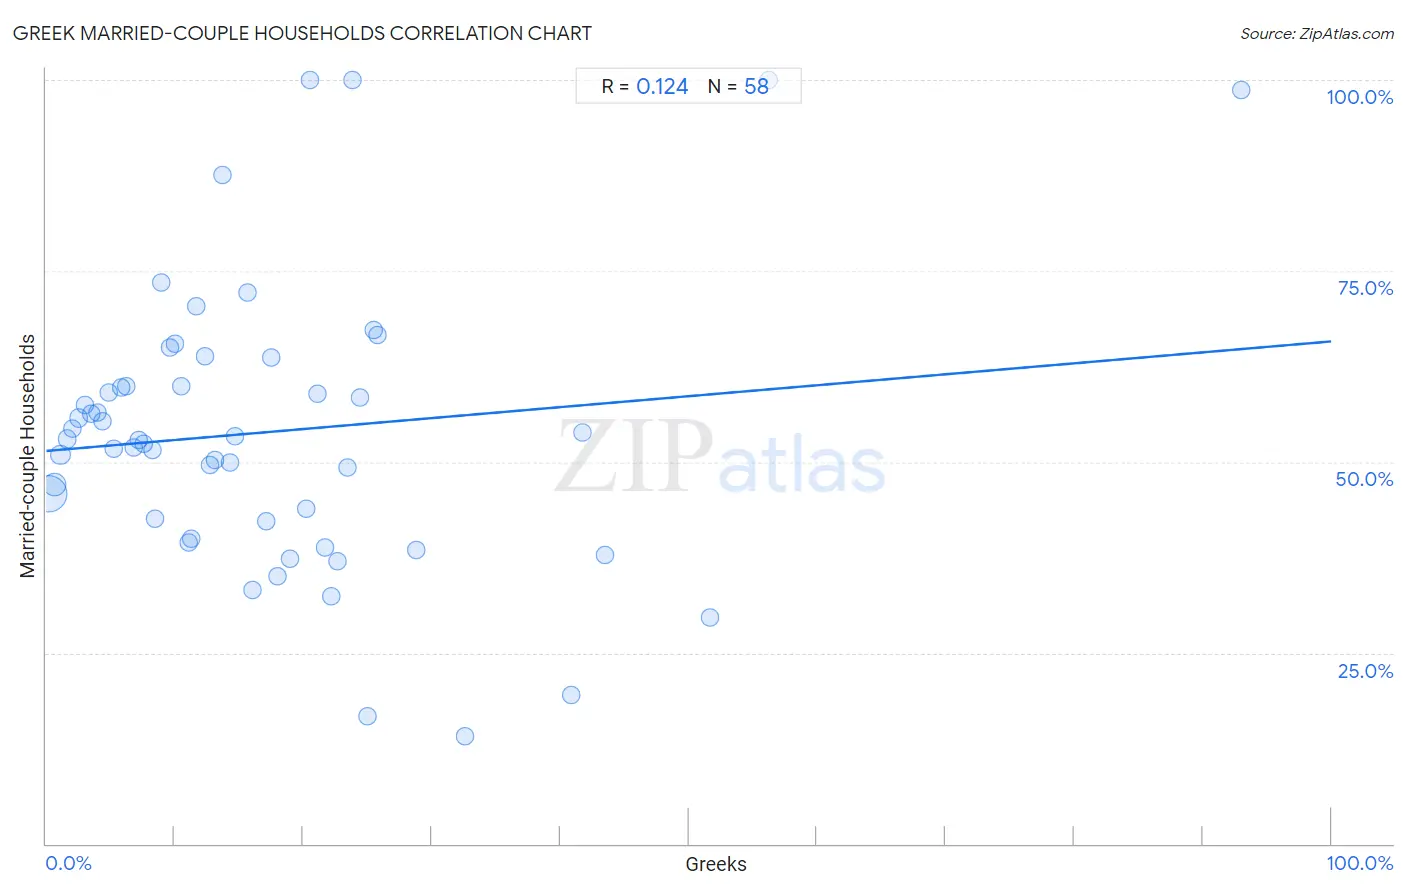
Greek Married-couple Households Correlation Chart
The statistical analysis conducted on geographies consisting of 482,332,211 people shows a poor positive correlation between the proportion of Greeks and percentage of married-couple family households in the United States with a correlation coefficient (R) of 0.124 and weighted average of 48.9%. On average, for every 1% (one percent) increase in Greeks within a typical geography, there is an increase of 0.14% in percentage of married-couple family households.
It is essential to understand that the correlation between the percentage of Greeks and percentage of married-couple family households does not imply a direct cause-and-effect relationship. It remains uncertain whether the presence of Greeks influences an upward or downward trend in the level of percentage of married-couple family households within an area, or if Greeks simply ended up residing in those areas with higher or lower levels of percentage of married-couple family households due to other factors.
Demographics Similar to Greeks by Married-couple Households
In terms of married-couple households, the demographic groups most similar to Greeks are Lithuanian (48.9%, a difference of 0.080%), Sri Lankan (49.0%, a difference of 0.090%), Iranian (49.0%, a difference of 0.10%), Immigrants from Bolivia (48.9%, a difference of 0.10%), and Immigrants from Lebanon (48.9%, a difference of 0.13%).
| Demographics | Rating | Rank | Married-couple Households |
| Native Hawaiians | 99.8 /100 | #31 | Exceptional 49.1% |
| Hungarians | 99.8 /100 | #32 | Exceptional 49.1% |
| Immigrants from Asia | 99.7 /100 | #33 | Exceptional 49.1% |
| Italians | 99.7 /100 | #34 | Exceptional 49.0% |
| Scottish | 99.7 /100 | #35 | Exceptional 49.0% |
| Iranians | 99.7 /100 | #36 | Exceptional 49.0% |
| Sri Lankans | 99.7 /100 | #37 | Exceptional 49.0% |
| Greeks | 99.7 /100 | #38 | Exceptional 48.9% |
| Lithuanians | 99.6 /100 | #39 | Exceptional 48.9% |
| Immigrants from Bolivia | 99.6 /100 | #40 | Exceptional 48.9% |
| Immigrants from Lebanon | 99.6 /100 | #41 | Exceptional 48.9% |
| Immigrants from Vietnam | 99.6 /100 | #42 | Exceptional 48.8% |
| Immigrants from Iran | 99.6 /100 | #43 | Exceptional 48.8% |
| Welsh | 99.5 /100 | #44 | Exceptional 48.8% |
| Immigrants from Eastern Asia | 99.5 /100 | #45 | Exceptional 48.8% |
Greek Married-couple Households Correlation Summary
| Measurement | Greek Data | Married-couple Households Data |
| Minimum | 0.21% | 14.1% |
| Maximum | 93.0% | 100.0% |
| Range | 92.8% | 85.9% |
| Mean | 17.3% | 53.9% |
| Median | 13.4% | 53.0% |
| Interquartile 25% (IQ1) | 6.8% | 42.3% |
| Interquartile 75% (IQ3) | 22.6% | 60.0% |
| Interquartile Range (IQR) | 15.8% | 17.7% |
| Standard Deviation (Sample) | 16.1% | 18.6% |
| Standard Deviation (Population) | 16.0% | 18.5% |
Correlation Details
| Greek Percentile | Sample Size | Married-couple Households |
[ 0.0% - 0.5% ] 0.21% | 329,876,228 | 45.8% |
[ 0.5% - 1.0% ] 0.65% | 103,081,563 | 47.0% |
[ 1.0% - 1.5% ] 1.11% | 27,097,576 | 50.9% |
[ 1.5% - 2.0% ] 1.61% | 11,000,452 | 53.0% |
[ 2.0% - 2.5% ] 2.06% | 4,387,797 | 54.3% |
[ 2.5% - 3.0% ] 2.55% | 2,862,811 | 55.7% |
[ 2.5% - 3.0% ] 3.00% | 1,536,095 | 57.4% |
[ 3.0% - 3.5% ] 3.50% | 787,222 | 56.3% |
[ 3.5% - 4.0% ] 3.95% | 346,651 | 56.5% |
[ 4.0% - 4.5% ] 4.40% | 504,599 | 55.4% |
[ 4.5% - 5.0% ] 4.91% | 154,577 | 59.0% |
[ 5.0% - 5.5% ] 5.29% | 165,642 | 51.6% |
[ 5.5% - 6.0% ] 5.82% | 133,894 | 59.7% |
[ 6.0% - 6.5% ] 6.20% | 103,495 | 59.9% |
[ 6.5% - 7.0% ] 6.80% | 60,642 | 51.8% |
[ 7.0% - 7.5% ] 7.17% | 86,850 | 52.9% |
[ 7.5% - 8.0% ] 7.60% | 31,375 | 52.3% |
[ 8.0% - 8.5% ] 8.24% | 3,848 | 51.6% |
[ 8.0% - 8.5% ] 8.48% | 2,499 | 42.5% |
[ 8.5% - 9.0% ] 8.93% | 1,534 | 73.5% |
[ 9.5% - 10.0% ] 9.63% | 8,390 | 65.0% |
[ 10.0% - 10.5% ] 10.01% | 7,410 | 65.5% |
[ 10.5% - 11.0% ] 10.50% | 1,019 | 60.0% |
[ 11.0% - 11.5% ] 11.10% | 13,147 | 39.4% |
[ 11.0% - 11.5% ] 11.31% | 50,738 | 40.0% |
[ 11.5% - 12.0% ] 11.72% | 2,612 | 70.4% |
[ 12.0% - 12.5% ] 12.35% | 2,833 | 63.8% |
[ 12.5% - 13.0% ] 12.79% | 1,267 | 49.6% |
[ 13.0% - 13.5% ] 13.17% | 463 | 50.3% |
[ 13.5% - 14.0% ] 13.68% | 665 | 87.6% |
[ 14.0% - 14.5% ] 14.29% | 525 | 49.9% |
[ 14.5% - 15.0% ] 14.71% | 3,773 | 53.4% |
[ 15.5% - 16.0% ] 15.61% | 4,374 | 72.2% |
[ 16.0% - 16.5% ] 16.01% | 1,443 | 33.2% |
[ 17.0% - 17.5% ] 17.07% | 943 | 42.3% |
[ 17.5% - 18.0% ] 17.53% | 753 | 63.6% |
[ 17.5% - 18.0% ] 17.95% | 234 | 35.0% |
[ 18.5% - 19.0% ] 18.95% | 438 | 37.4% |
[ 20.0% - 20.5% ] 20.28% | 646 | 43.8% |
[ 20.0% - 20.5% ] 20.48% | 83 | 100.0% |
[ 21.0% - 21.5% ] 21.15% | 2,151 | 59.0% |
[ 21.5% - 22.0% ] 21.68% | 143 | 38.8% |
[ 22.0% - 22.5% ] 22.22% | 72 | 32.4% |
[ 22.5% - 23.0% ] 22.63% | 137 | 36.9% |
[ 23.0% - 23.5% ] 23.43% | 700 | 49.2% |
[ 23.5% - 24.0% ] 23.86% | 88 | 100.0% |
[ 24.0% - 24.5% ] 24.42% | 86 | 58.4% |
[ 25.0% - 25.5% ] 25.00% | 8 | 16.7% |
[ 25.5% - 26.0% ] 25.51% | 396 | 67.3% |
[ 25.5% - 26.0% ] 25.77% | 392 | 66.7% |
[ 28.5% - 29.0% ] 28.83% | 111 | 38.5% |
[ 32.5% - 33.0% ] 32.59% | 313 | 14.1% |
[ 40.5% - 41.0% ] 40.85% | 71 | 19.5% |
[ 41.5% - 42.0% ] 41.77% | 79 | 53.8% |
[ 43.5% - 44.0% ] 43.52% | 108 | 37.8% |
[ 51.5% - 52.0% ] 51.65% | 91 | 29.5% |
[ 56.0% - 56.5% ] 56.25% | 16 | 100.0% |
[ 93.0% - 93.5% ] 93.01% | 143 | 98.6% |