German Russian 2 or more Vehicles in Household

COMPARE

German Russian
Race
Ancestry
AfghanAfricanAlaska NativeAlaskan AthabascanAlbanianAleutAlsatianAmericanApacheArabArapahoArgentineanArmenianAssyrian/Chaldean/SyriacAustralianAustrianBahamianBangladeshiBarbadianBasqueBelgianBelizeanBermudanBhutaneseBlackfeetBolivianBrazilianBritishBritish West IndianBulgarianBurmeseCajunCambodianCanadianCape VerdeanCarpatho RusynCelticCentral AmericanCentral American IndianCherokeeCheyenneChickasawChileanChineseChippewaChoctawColombianColvilleComancheCosta RicanCreeCreekCroatianCrowCubanCypriotCzechCzechoslovakianDanishDelawareDominicanDutchDutch West IndianEastern EuropeanEcuadorianEgyptianEnglishEstonianEthiopianEuropeanFijianFilipinoFinnishFrenchFrench American IndianFrench CanadianGermanGerman RussianGhanaianGreekGuamanian/ChamorroGuatemalanGuyaneseHaitianHmongHonduranHopiHoumaHungarianIcelanderIndian (Asian)IndonesianInupiatIranianIraqiIrishIroquoisIsraeliItalianJamaicanJapaneseJordanianKenyanKiowaKoreanLaotianLatvianLebaneseLiberianLithuanianLumbeeLuxembourgerMacedonianMalaysianMalteseMarshalleseMenomineeMexicanMexican American IndianMongolianMoroccanNative HawaiianNavajoNepaleseNew ZealanderNicaraguanNigerianNorthern EuropeanNorwegianOkinawanOsageOttawaPaiutePakistaniPalestinianPanamanianParaguayanPennsylvania GermanPeruvianPimaPolishPortuguesePotawatomiPuebloPuerto RicanPuget Sound SalishRomanianRussianSalvadoranSamoanScandinavianScotch-IrishScottishSeminoleSenegaleseSerbianShoshoneSierra LeoneanSiouxSlavicSlovakSloveneSomaliSouth AfricanSouth AmericanSouth American IndianSoviet UnionSpaniardSpanishSpanish AmericanSpanish American IndianSri LankanSubsaharan AfricanSudaneseSwedishSwissSyrianTaiwaneseThaiTlingit-HaidaTohono O'OdhamTonganTrinidadian and TobagonianTsimshianTurkishU.S. Virgin IslanderUgandanUkrainianUruguayanUteVenezuelanVietnameseWelshWest IndianYakamaYaquiYugoslavianYumanYup'ikZimbabwean
Immigration
NonimmigrantsImmigrantsAfghanistanAfricaAlbaniaArgentinaArmeniaAsiaAustraliaAustriaBahamasBangladeshBarbadosBelarusBelgiumBelizeBoliviaBosnia and HerzegovinaBrazilBulgariaBurma/MyanmarCabo VerdeCambodiaCameroonCanadaCaribbeanCentral AmericaChileChinaColombiaCongoCosta RicaCroatiaCubaCzechoslovakiaDenmarkDominicaDominican RepublicEastern AfricaEastern AsiaEastern EuropeEcuadorEgyptEl SalvadorEnglandEritreaEthiopiaEuropeFijiFranceGermanyGhanaGreeceGrenadaGuatemalaGuyanaHaitiHondurasHong KongHungaryIndiaIndonesiaIranIraqIrelandIsraelItalyJamaicaJapanJordanKazakhstanKenyaKoreaKuwaitLaosLatin AmericaLatviaLebanonLiberiaLithuaniaMalaysiaMexicoMicronesiaMiddle AfricaMoldovaMoroccoNepalNetherlandsNicaraguaNigeriaNorth AmericaNorth MacedoniaNorthern AfricaNorthern EuropeNorwayOceaniaPakistanPanamaPeruPhilippinesPolandPortugalRomaniaRussiaSaudi ArabiaScotlandSenegalSerbiaSierra LeoneSingaporeSomaliaSouth AfricaSouth AmericaSouth Central AsiaSouth Eastern AsiaSouthern EuropeSpainSri LankaSt. Vincent and the GrenadinesSudanSwedenSwitzerlandSyriaTaiwanThailandTrinidad and TobagoTurkeyUgandaUkraineUruguayUzbekistanVenezuelaVietnamWest IndiesWestern AfricaWestern AsiaWestern EuropeYemenZaireZimbabweAzores
Select to Compare
Race
Ancestry
AfghanAfricanAlaska NativeAlaskan AthabascanAlbanianAleutAlsatianAmericanApacheArabArapahoArgentineanArmenianAssyrian/Chaldean/SyriacAustralianAustrianBahamianBangladeshiBarbadianBasqueBelgianBelizeanBermudanBhutaneseBlackfeetBolivianBrazilianBritishBritish West IndianBulgarianBurmeseCajunCambodianCanadianCape VerdeanCarpatho RusynCelticCentral AmericanCentral American IndianCherokeeCheyenneChickasawChileanChineseChippewaChoctawColombianColvilleComancheCosta RicanCreeCreekCroatianCrowCubanCypriotCzechCzechoslovakianDanishDelawareDominicanDutchDutch West IndianEastern EuropeanEcuadorianEgyptianEnglishEstonianEthiopianEuropeanFijianFilipinoFinnishFrenchFrench American IndianFrench CanadianGermanGhanaianGreekGuamanian/ChamorroGuatemalanGuyaneseHaitianHmongHonduranHopiHoumaHungarianIcelanderIndian (Asian)IndonesianInupiatIranianIraqiIrishIroquoisIsraeliItalianJamaicanJapaneseJordanianKenyanKiowaKoreanLaotianLatvianLebaneseLiberianLithuanianLumbeeLuxembourgerMacedonianMalaysianMalteseMarshalleseMenomineeMexicanMexican American IndianMongolianMoroccanNative HawaiianNavajoNepaleseNew ZealanderNicaraguanNigerianNorthern EuropeanNorwegianOkinawanOsageOttawaPaiutePakistaniPalestinianPanamanianParaguayanPennsylvania GermanPeruvianPimaPolishPortuguesePotawatomiPuebloPuerto RicanPuget Sound SalishRomanianRussianSalvadoranSamoanScandinavianScotch-IrishScottishSeminoleSenegaleseSerbianShoshoneSierra LeoneanSiouxSlavicSlovakSloveneSomaliSouth AfricanSouth AmericanSouth American IndianSoviet UnionSpaniardSpanishSpanish AmericanSpanish American IndianSri LankanSubsaharan AfricanSudaneseSwedishSwissSyrianTaiwaneseThaiTlingit-HaidaTohono O'OdhamTonganTrinidadian and TobagonianTsimshianTurkishU.S. Virgin IslanderUgandanUkrainianUruguayanUteVenezuelanVietnameseWelshWest IndianYakamaYaquiYugoslavianYumanYup'ikZimbabwean
Immigration
NonimmigrantsImmigrantsAfghanistanAfricaAlbaniaArgentinaArmeniaAsiaAustraliaAustriaBahamasBangladeshBarbadosBelarusBelgiumBelizeBoliviaBosnia and HerzegovinaBrazilBulgariaBurma/MyanmarCabo VerdeCambodiaCameroonCanadaCaribbeanCentral AmericaChileChinaColombiaCongoCosta RicaCroatiaCubaCzechoslovakiaDenmarkDominicaDominican RepublicEastern AfricaEastern AsiaEastern EuropeEcuadorEgyptEl SalvadorEnglandEritreaEthiopiaEuropeFijiFranceGermanyGhanaGreeceGrenadaGuatemalaGuyanaHaitiHondurasHong KongHungaryIndiaIndonesiaIranIraqIrelandIsraelItalyJamaicaJapanJordanKazakhstanKenyaKoreaKuwaitLaosLatin AmericaLatviaLebanonLiberiaLithuaniaMalaysiaMexicoMicronesiaMiddle AfricaMoldovaMoroccoNepalNetherlandsNicaraguaNigeriaNorth AmericaNorth MacedoniaNorthern AfricaNorthern EuropeNorwayOceaniaPakistanPanamaPeruPhilippinesPolandPortugalRomaniaRussiaSaudi ArabiaScotlandSenegalSerbiaSierra LeoneSingaporeSomaliaSouth AfricaSouth AmericaSouth Central AsiaSouth Eastern AsiaSouthern EuropeSpainSri LankaSt. Vincent and the GrenadinesSudanSwedenSwitzerlandSyriaTaiwanThailandTrinidad and TobagoTurkeyUgandaUkraineUruguayUzbekistanVenezuelaVietnamWest IndiesWestern AfricaWestern AsiaWestern EuropeYemenZaireZimbabweAzores
2 or more Vehicles in Household
Income
Poverty
Unemployment
Labor Participation
Family Structure
Vehicle Availability
Education Level
Disability

German Russian 2 or more Vehicles in Household
Good

55.6%
2+ VEHICLES AVAILABLE
60.9/ 100
METRIC RATING
162nd/ 347
METRIC RANK

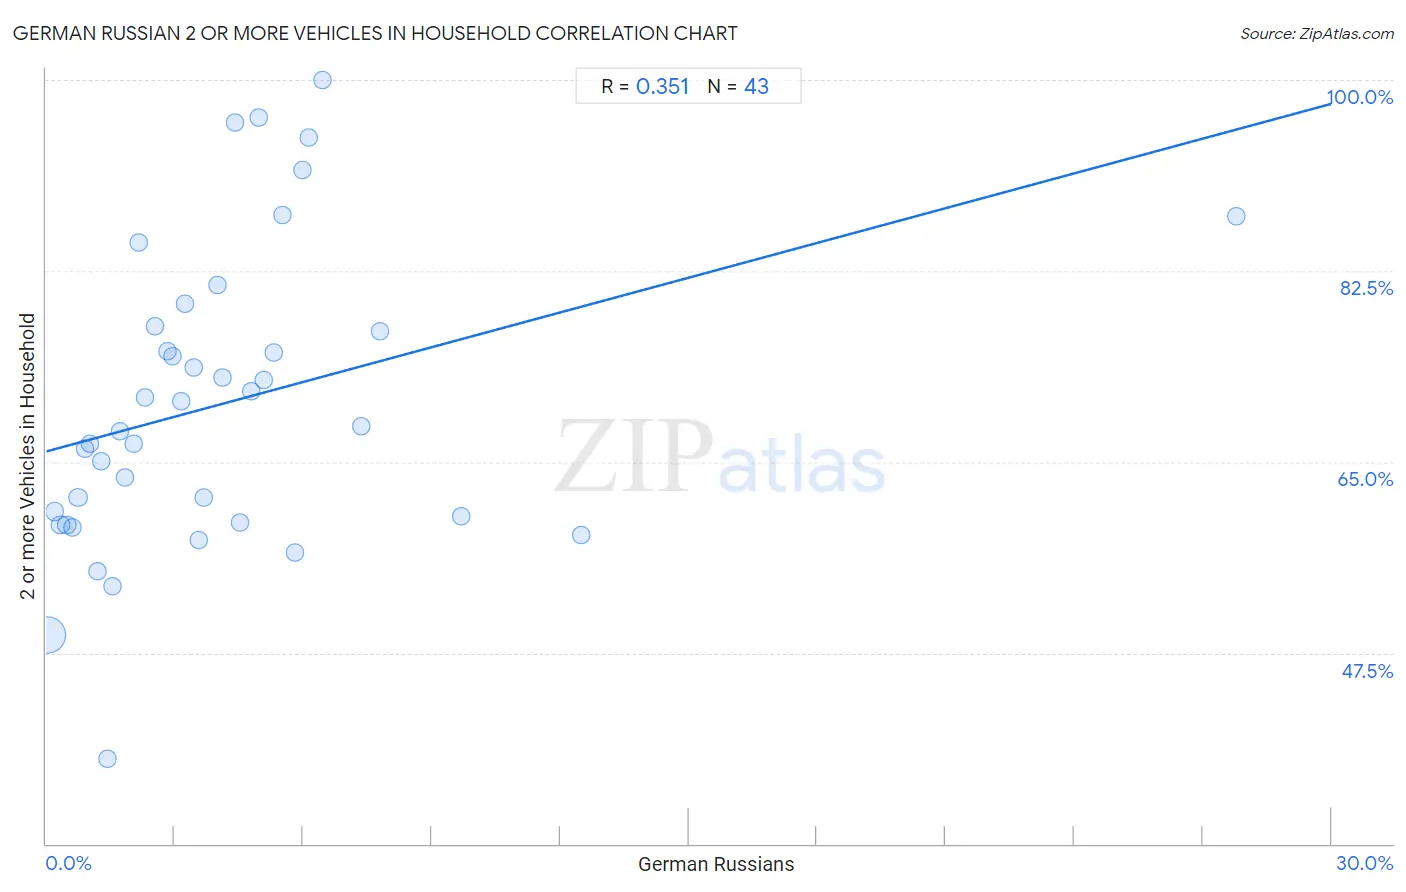
German Russian 2 or more Vehicles in Household Correlation Chart

The statistical analysis conducted on geographies consisting of 96,451,375 people shows a mild positive correlation between the proportion of German Russians and percentage of households with 2 or more vehicles available in the United States with a correlation coefficient (R) of 0.351 and weighted average of 55.6%. On average, for every 1% (one percent) increase in German Russians within a typical geography, there is an increase of 1.1% in percentage of households with 2 or more vehicles available.
German Russian 2 or more Vehicles in Household
It is essential to understand that the correlation between the percentage of German Russians and percentage of households with 2 or more vehicles available does not imply a direct cause-and-effect relationship. It remains uncertain whether the presence of German Russians influences an upward or downward trend in the level of percentage of households with 2 or more vehicles available within an area, or if German Russians simply ended up residing in those areas with higher or lower levels of percentage of households with 2 or more vehicles available due to other factors.

Demographics Similar to German Russians by 2 or more Vehicles in Household

In terms of 2 or more vehicles in household, the demographic groups most similar to German Russians are Colville (55.6%, a difference of 0.010%), Immigrants from Zimbabwe (55.6%, a difference of 0.030%), Dutch West Indian (55.6%, a difference of 0.040%), Immigrants from El Salvador (55.6%, a difference of 0.060%), and Immigrants from Sri Lanka (55.5%, a difference of 0.10%).
DemographicsRating | Rank2 or more Vehicles in Household
Immigrants from Venezuela
70.7
/100
|
#155
Good
55.8%
Immigrants from Lithuania
70.4
/100
|
#156
Good
55.8%
Immigrants from Kuwait
70.2
/100
|
#157
Good
55.8%
Tlingit-Haida
68.5
/100
|
#158
Good
55.8%
Paiute
68.0
/100
|
#159
Good
55.8%
Crow
67.0
/100
|
#160
Good
55.7%
Colville
61.1
/100
|
#161
Good
55.6%
German Russians
60.9
/100
|
#162
Good
55.6%
Immigrants from Zimbabwe
60.2
/100
|
#163
Good
55.6%
Dutch West Indians
59.8
/100
|
#164
Average
55.6%
Immigrants from El Salvador
59.4
/100
|
#165
Average
55.6%
Immigrants from Sri Lanka
58.3
/100
|
#166
Average
55.5%
Kenyans
58.1
/100
|
#167
Average
55.5%
French American Indians
56.7
/100
|
#168
Average
55.5%
Immigrants from Austria
56.3
/100
|
#169
Average
55.5%

German Russian 2 or more Vehicles in Household Correlation Summary

MeasurementGerman Russian Data2 or more Vehicles in Household Data
Minimum0.022%37.7%
Maximum27.8%100.0%
Range27.8%62.3%
Mean4.1%70.3%
Median3.2%68.2%
Interquartile 25% (IQ1)1.4%59.5%
Interquartile 75% (IQ3)5.3%77.5%
Interquartile Range (IQR)3.9%18.0%
Standard Deviation (Sample)4.6%13.8%
Standard Deviation (Population)4.5%13.6%

Correlation Details

German Russian PercentileSample Size2 or more Vehicles in Household
[
0.0%
-
0.5%
]
0.022%
90,575,54749.2%
[
0.0%
-
0.5%
]
0.20%
3,273,66760.4%
[
0.0%
-
0.5%
]
0.34%
1,043,95959.3%
[
0.0%
-
0.5%
]
0.48%
533,66859.2%
[
0.5%
-
1.0%
]
0.62%
283,17959.0%
[
0.5%
-
1.0%
]
0.74%
218,66461.8%
[
0.5%
-
1.0%
]
0.90%
56,64266.2%
[
1.0%
-
1.5%
]
1.03%
153,08166.6%
[
1.0%
-
1.5%
]
1.20%
96,51055.0%
[
1.0%
-
1.5%
]
1.29%
73,95865.1%
[
1.0%
-
1.5%
]
1.44%
11,45737.7%
[
1.5%
-
2.0%
]
1.56%
43,36753.6%
[
1.5%
-
2.0%
]
1.73%
1,73767.9%
[
1.5%
-
2.0%
]
1.85%
32,99863.6%
[
2.0%
-
2.5%
]
2.05%
6,10366.7%
[
2.0%
-
2.5%
]
2.16%
9,20985.1%
[
2.0%
-
2.5%
]
2.32%
7,93870.9%
[
2.5%
-
3.0%
]
2.54%
2,39777.5%
[
2.5%
-
3.0%
]
2.84%
2,67975.2%
[
2.5%
-
3.0%
]
2.95%
61174.7%
[
3.0%
-
3.5%
]
3.15%
34970.6%
[
3.0%
-
3.5%
]
3.23%
2,28879.5%
[
3.0%
-
3.5%
]
3.44%
1,28073.6%
[
3.5%
-
4.0%
]
3.56%
12,59357.8%
[
3.5%
-
4.0%
]
3.67%
10961.8%
[
4.0%
-
4.5%
]
4.00%
2581.2%
[
4.0%
-
4.5%
]
4.10%
2,29272.7%
[
4.0%
-
4.5%
]
4.40%
45596.2%
[
4.5%
-
5.0%
]
4.52%
95159.5%
[
4.5%
-
5.0%
]
4.80%
12571.5%
[
4.5%
-
5.0%
]
4.97%
52396.6%
[
5.0%
-
5.5%
]
5.07%
13872.5%
[
5.0%
-
5.5%
]
5.32%
80875.0%
[
5.5%
-
6.0%
]
5.50%
21887.6%
[
5.5%
-
6.0%
]
5.82%
46456.7%
[
5.5%
-
6.0%
]
5.97%
70391.8%
[
6.0%
-
6.5%
]
6.12%
4994.7%
[
6.0%
-
6.5%
]
6.45%
31100.0%
[
7.0%
-
7.5%
]
7.36%
23168.2%
[
7.5%
-
8.0%
]
7.78%
9076.9%
[
9.5%
-
10.0%
]
9.68%
24860.0%
[
12.0%
-
12.5%
]
12.50%
1658.3%
[
27.5%
-
28.0%
]
27.78%
1887.5%