German Russian GED/Equivalency
COMPARE
German Russian
Select to Compare
GED/Equivalency
German Russian GED/Equivalency
86.2%
GED/EQUIVALENCY
72.1/ 100
METRIC RATING
158th/ 347
METRIC RANK
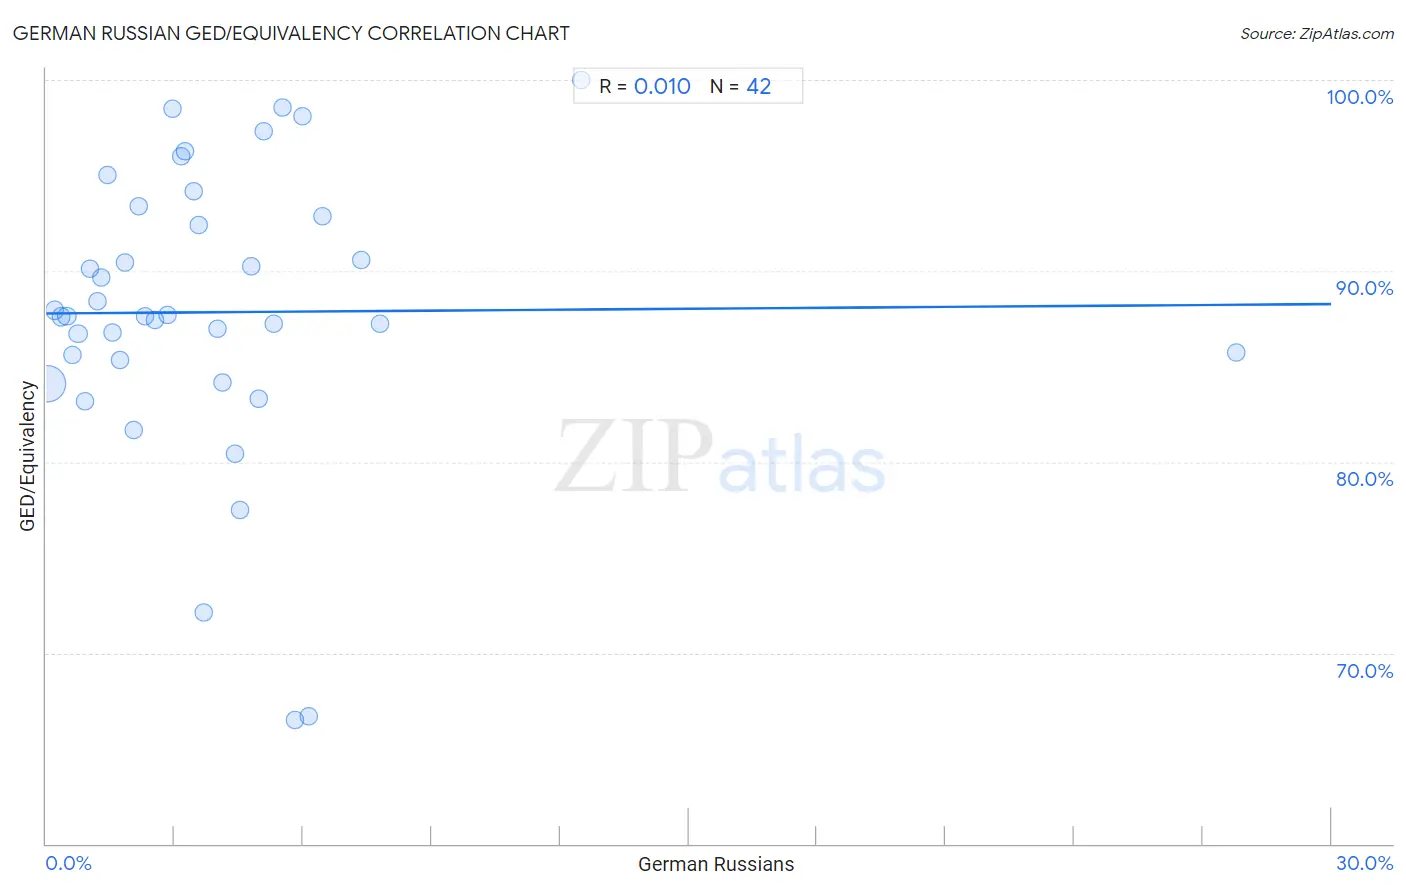
German Russian GED/Equivalency Correlation Chart
The statistical analysis conducted on geographies consisting of 96,461,736 people shows no correlation between the proportion of German Russians and percentage of population with at least ged/equivalency education in the United States with a correlation coefficient (R) of 0.010 and weighted average of 86.2%. On average, for every 1% (one percent) increase in German Russians within a typical geography, there is an increase of 0.016% in percentage of population with at least ged/equivalency education.
It is essential to understand that the correlation between the percentage of German Russians and percentage of population with at least ged/equivalency education does not imply a direct cause-and-effect relationship. It remains uncertain whether the presence of German Russians influences an upward or downward trend in the level of percentage of population with at least ged/equivalency education within an area, or if German Russians simply ended up residing in those areas with higher or lower levels of percentage of population with at least ged/equivalency education due to other factors.
Demographics Similar to German Russians by GED/Equivalency
In terms of ged/equivalency, the demographic groups most similar to German Russians are White/Caucasian (86.2%, a difference of 0.0%), Immigrants from Kenya (86.2%, a difference of 0.010%), Immigrants from Nepal (86.2%, a difference of 0.030%), Immigrants from Morocco (86.1%, a difference of 0.060%), and Immigrants from Syria (86.1%, a difference of 0.070%).
| Demographics | Rating | Rank | GED/Equivalency |
| Immigrants from Bosnia and Herzegovina | 77.9 /100 | #151 | Good 86.3% |
| Brazilians | 77.2 /100 | #152 | Good 86.3% |
| Kenyans | 76.6 /100 | #153 | Good 86.3% |
| Armenians | 76.4 /100 | #154 | Good 86.3% |
| Iraqis | 75.2 /100 | #155 | Good 86.2% |
| Immigrants from Nepal | 73.3 /100 | #156 | Good 86.2% |
| Whites/Caucasians | 72.2 /100 | #157 | Good 86.2% |
| German Russians | 72.1 /100 | #158 | Good 86.2% |
| Immigrants from Kenya | 71.8 /100 | #159 | Good 86.2% |
| Immigrants from Morocco | 69.5 /100 | #160 | Good 86.1% |
| Immigrants from Syria | 69.3 /100 | #161 | Good 86.1% |
| Immigrants from Iraq | 68.1 /100 | #162 | Good 86.1% |
| Ugandans | 66.3 /100 | #163 | Good 86.1% |
| Venezuelans | 65.5 /100 | #164 | Good 86.0% |
| Alsatians | 64.3 /100 | #165 | Good 86.0% |
German Russian GED/Equivalency Correlation Summary
| Measurement | German Russian Data | GED/Equivalency Data |
| Minimum | 0.022% | 66.5% |
| Maximum | 27.8% | 100.0% |
| Range | 27.8% | 33.5% |
| Mean | 4.0% | 87.8% |
| Median | 3.2% | 87.6% |
| Interquartile 25% (IQ1) | 1.4% | 85.4% |
| Interquartile 75% (IQ3) | 5.1% | 92.9% |
| Interquartile Range (IQR) | 3.6% | 7.5% |
| Standard Deviation (Sample) | 4.5% | 7.6% |
| Standard Deviation (Population) | 4.5% | 7.5% |
Correlation Details
| German Russian Percentile | Sample Size | GED/Equivalency |
[ 0.0% - 0.5% ] 0.022% | 90,575,547 | 84.1% |
[ 0.0% - 0.5% ] 0.20% | 3,276,672 | 87.9% |
[ 0.0% - 0.5% ] 0.34% | 1,045,666 | 87.6% |
[ 0.0% - 0.5% ] 0.48% | 533,668 | 87.6% |
[ 0.5% - 1.0% ] 0.62% | 283,179 | 85.6% |
[ 0.5% - 1.0% ] 0.74% | 219,743 | 86.7% |
[ 0.5% - 1.0% ] 0.90% | 56,642 | 83.2% |
[ 1.0% - 1.5% ] 1.03% | 153,081 | 90.1% |
[ 1.0% - 1.5% ] 1.20% | 96,510 | 88.4% |
[ 1.0% - 1.5% ] 1.29% | 73,958 | 89.7% |
[ 1.0% - 1.5% ] 1.44% | 11,457 | 95.0% |
[ 1.5% - 2.0% ] 1.56% | 43,367 | 86.8% |
[ 1.5% - 2.0% ] 1.73% | 1,737 | 85.4% |
[ 1.5% - 2.0% ] 1.84% | 37,816 | 90.4% |
[ 2.0% - 2.5% ] 2.05% | 6,103 | 81.7% |
[ 2.0% - 2.5% ] 2.16% | 9,209 | 93.4% |
[ 2.0% - 2.5% ] 2.32% | 7,938 | 87.6% |
[ 2.5% - 3.0% ] 2.54% | 2,397 | 87.4% |
[ 2.5% - 3.0% ] 2.84% | 2,679 | 87.7% |
[ 2.5% - 3.0% ] 2.95% | 611 | 98.5% |
[ 3.0% - 3.5% ] 3.15% | 349 | 96.0% |
[ 3.0% - 3.5% ] 3.23% | 2,288 | 96.3% |
[ 3.0% - 3.5% ] 3.44% | 1,280 | 94.1% |
[ 3.5% - 4.0% ] 3.56% | 12,593 | 92.4% |
[ 3.5% - 4.0% ] 3.67% | 109 | 72.1% |
[ 4.0% - 4.5% ] 4.00% | 25 | 87.0% |
[ 4.0% - 4.5% ] 4.10% | 2,292 | 84.2% |
[ 4.0% - 4.5% ] 4.40% | 455 | 80.4% |
[ 4.5% - 5.0% ] 4.52% | 951 | 77.5% |
[ 4.5% - 5.0% ] 4.80% | 125 | 90.3% |
[ 4.5% - 5.0% ] 4.97% | 523 | 83.3% |
[ 5.0% - 5.5% ] 5.07% | 138 | 97.3% |
[ 5.0% - 5.5% ] 5.32% | 808 | 87.2% |
[ 5.5% - 6.0% ] 5.50% | 218 | 98.6% |
[ 5.5% - 6.0% ] 5.82% | 464 | 66.5% |
[ 5.5% - 6.0% ] 5.97% | 703 | 98.1% |
[ 6.0% - 6.5% ] 6.12% | 49 | 66.7% |
[ 6.0% - 6.5% ] 6.45% | 31 | 92.9% |
[ 7.0% - 7.5% ] 7.36% | 231 | 90.6% |
[ 7.5% - 8.0% ] 7.78% | 90 | 87.2% |
[ 12.0% - 12.5% ] 12.50% | 16 | 100.0% |
[ 27.5% - 28.0% ] 27.78% | 18 | 85.7% |