German Russian 1 or more Vehicles in Household
COMPARE
German Russian
Select to Compare
1 or more Vehicles in Household
German Russian 1 or more Vehicles in Household
89.6%
1+ VEHICLES AVAILABLE
44.0/ 100
METRIC RATING
179th/ 347
METRIC RANK
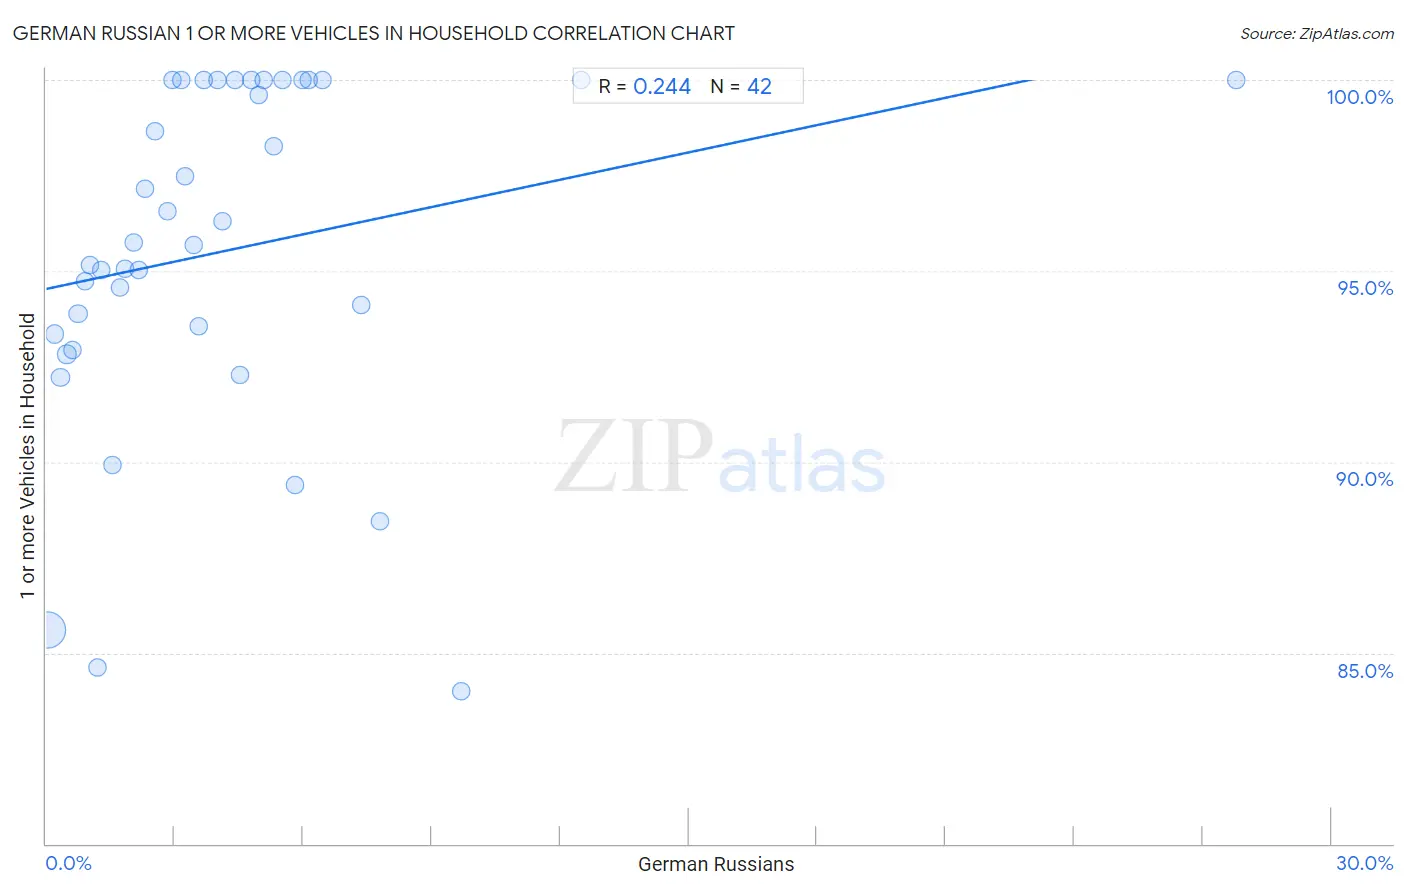
German Russian 1 or more Vehicles in Household Correlation Chart
The statistical analysis conducted on geographies consisting of 96,439,918 people shows a weak positive correlation between the proportion of German Russians and percentage of households with 1 or more vehicles available in the United States with a correlation coefficient (R) of 0.244 and weighted average of 89.6%. On average, for every 1% (one percent) increase in German Russians within a typical geography, there is an increase of 0.24% in percentage of households with 1 or more vehicles available.
It is essential to understand that the correlation between the percentage of German Russians and percentage of households with 1 or more vehicles available does not imply a direct cause-and-effect relationship. It remains uncertain whether the presence of German Russians influences an upward or downward trend in the level of percentage of households with 1 or more vehicles available within an area, or if German Russians simply ended up residing in those areas with higher or lower levels of percentage of households with 1 or more vehicles available due to other factors.
Demographics Similar to German Russians by 1 or more Vehicles in Household
In terms of 1 or more vehicles in household, the demographic groups most similar to German Russians are Immigrants from El Salvador (89.6%, a difference of 0.0%), Arab (89.6%, a difference of 0.010%), Immigrants from Ethiopia (89.6%, a difference of 0.020%), Hmong (89.6%, a difference of 0.030%), and Ukrainian (89.6%, a difference of 0.030%).
| Demographics | Rating | Rank | 1 or more Vehicles in Household |
| Indonesians | 53.0 /100 | #172 | Average 89.7% |
| Lumbee | 52.8 /100 | #173 | Average 89.7% |
| Filipinos | 50.0 /100 | #174 | Average 89.7% |
| Immigrants from Burma/Myanmar | 47.6 /100 | #175 | Average 89.7% |
| Immigrants from Sudan | 47.1 /100 | #176 | Average 89.7% |
| Hmong | 45.8 /100 | #177 | Average 89.6% |
| Immigrants from El Salvador | 44.1 /100 | #178 | Average 89.6% |
| German Russians | 44.0 /100 | #179 | Average 89.6% |
| Arabs | 43.3 /100 | #180 | Average 89.6% |
| Immigrants from Ethiopia | 42.5 /100 | #181 | Average 89.6% |
| Ukrainians | 42.4 /100 | #182 | Average 89.6% |
| Ethiopians | 41.2 /100 | #183 | Average 89.6% |
| Immigrants from Bulgaria | 40.7 /100 | #184 | Average 89.6% |
| Immigrants from Brazil | 40.1 /100 | #185 | Average 89.6% |
| Pueblo | 39.9 /100 | #186 | Fair 89.6% |
German Russian 1 or more Vehicles in Household Correlation Summary
| Measurement | German Russian Data | 1 or more Vehicles in Household Data |
| Minimum | 0.022% | 84.0% |
| Maximum | 27.8% | 100.0% |
| Range | 27.8% | 16.0% |
| Mean | 4.2% | 95.5% |
| Median | 3.3% | 95.7% |
| Interquartile 25% (IQ1) | 1.6% | 93.3% |
| Interquartile 75% (IQ3) | 5.3% | 100.0% |
| Interquartile Range (IQR) | 3.8% | 6.7% |
| Standard Deviation (Sample) | 4.6% | 4.5% |
| Standard Deviation (Population) | 4.5% | 4.4% |
Correlation Details
| German Russian Percentile | Sample Size | 1 or more Vehicles in Household |
[ 0.0% - 0.5% ] 0.022% | 90,575,547 | 85.6% |
[ 0.0% - 0.5% ] 0.20% | 3,273,667 | 93.3% |
[ 0.0% - 0.5% ] 0.34% | 1,043,959 | 92.2% |
[ 0.0% - 0.5% ] 0.48% | 533,668 | 92.8% |
[ 0.5% - 1.0% ] 0.62% | 283,179 | 92.9% |
[ 0.5% - 1.0% ] 0.74% | 218,664 | 93.9% |
[ 0.5% - 1.0% ] 0.90% | 56,642 | 94.7% |
[ 1.0% - 1.5% ] 1.03% | 153,081 | 95.2% |
[ 1.0% - 1.5% ] 1.20% | 96,510 | 84.6% |
[ 1.0% - 1.5% ] 1.29% | 73,958 | 95.0% |
[ 1.5% - 2.0% ] 1.56% | 43,367 | 89.9% |
[ 1.5% - 2.0% ] 1.73% | 1,737 | 94.6% |
[ 1.5% - 2.0% ] 1.85% | 32,998 | 95.1% |
[ 2.0% - 2.5% ] 2.05% | 6,103 | 95.7% |
[ 2.0% - 2.5% ] 2.16% | 9,209 | 95.0% |
[ 2.0% - 2.5% ] 2.32% | 7,938 | 97.2% |
[ 2.5% - 3.0% ] 2.54% | 2,397 | 98.7% |
[ 2.5% - 3.0% ] 2.84% | 2,679 | 96.5% |
[ 2.5% - 3.0% ] 2.95% | 611 | 100.0% |
[ 3.0% - 3.5% ] 3.15% | 349 | 100.0% |
[ 3.0% - 3.5% ] 3.23% | 2,288 | 97.5% |
[ 3.0% - 3.5% ] 3.44% | 1,280 | 95.7% |
[ 3.5% - 4.0% ] 3.56% | 12,593 | 93.5% |
[ 3.5% - 4.0% ] 3.67% | 109 | 100.0% |
[ 4.0% - 4.5% ] 4.00% | 25 | 100.0% |
[ 4.0% - 4.5% ] 4.10% | 2,292 | 96.3% |
[ 4.0% - 4.5% ] 4.40% | 455 | 100.0% |
[ 4.5% - 5.0% ] 4.52% | 951 | 92.3% |
[ 4.5% - 5.0% ] 4.80% | 125 | 100.0% |
[ 4.5% - 5.0% ] 4.97% | 523 | 99.6% |
[ 5.0% - 5.5% ] 5.07% | 138 | 100.0% |
[ 5.0% - 5.5% ] 5.32% | 808 | 98.3% |
[ 5.5% - 6.0% ] 5.50% | 218 | 100.0% |
[ 5.5% - 6.0% ] 5.82% | 464 | 89.4% |
[ 5.5% - 6.0% ] 5.97% | 703 | 100.0% |
[ 6.0% - 6.5% ] 6.12% | 49 | 100.0% |
[ 6.0% - 6.5% ] 6.45% | 31 | 100.0% |
[ 7.0% - 7.5% ] 7.36% | 231 | 94.1% |
[ 7.5% - 8.0% ] 7.78% | 90 | 88.5% |
[ 9.5% - 10.0% ] 9.68% | 248 | 84.0% |
[ 12.0% - 12.5% ] 12.50% | 16 | 100.0% |
[ 27.5% - 28.0% ] 27.78% | 18 | 100.0% |