German Russian Disability
COMPARE
German Russian
Select to Compare
Disability
German Russian Disability
12.3%
DISABILITY
0.8/ 100
METRIC RATING
254th/ 347
METRIC RANK
German Russian Disability Correlation Chart
The statistical analysis conducted on geographies consisting of 96,458,633 people shows a poor positive correlation between the proportion of German Russians and percentage of population with a disability in the United States with a correlation coefficient (R) of 0.104 and weighted average of 12.3%. On average, for every 1% (one percent) increase in German Russians within a typical geography, there is an increase of 0.098% in percentage of population with a disability.
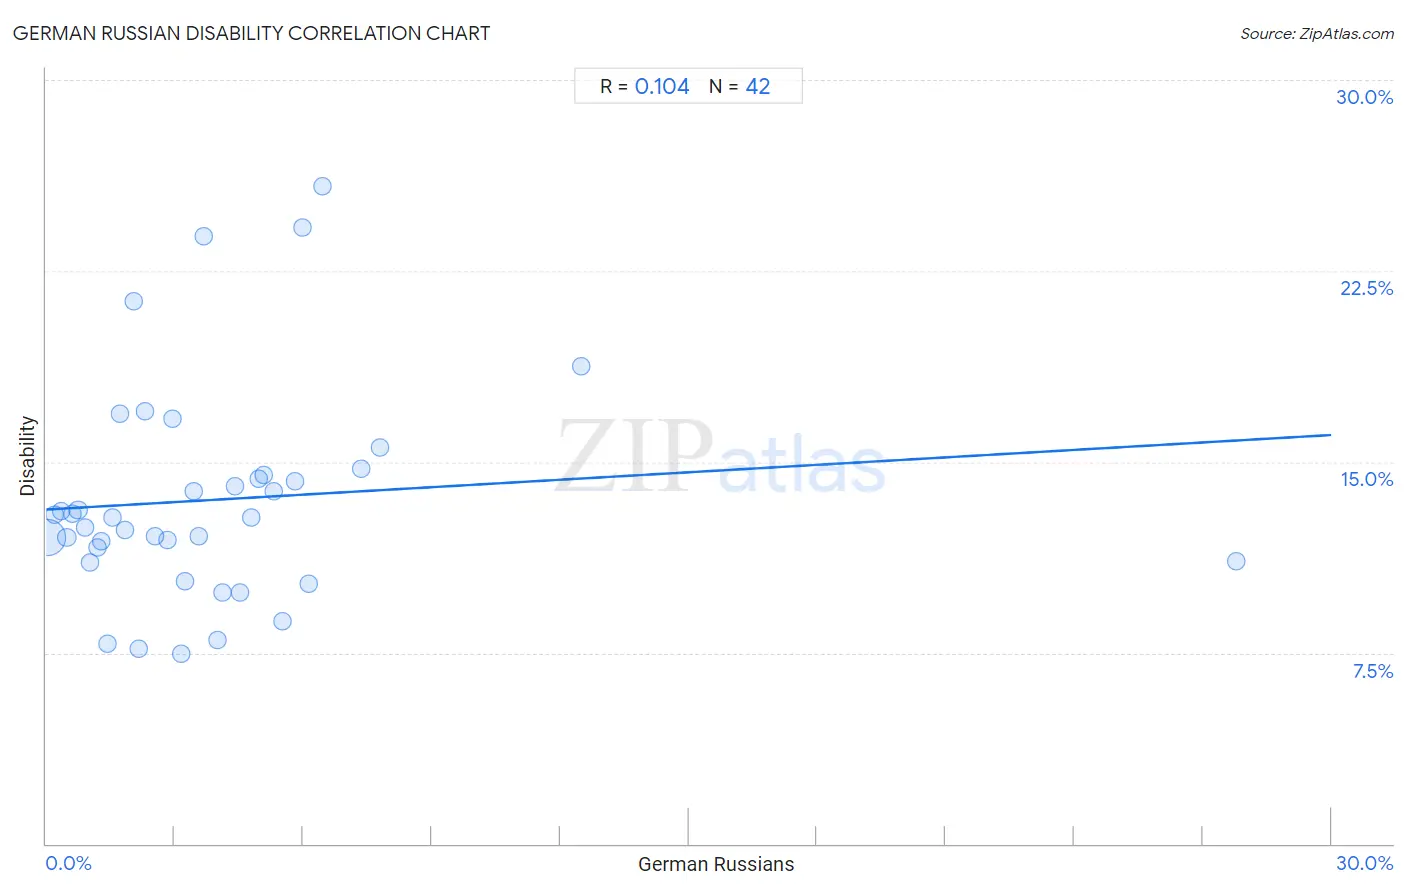
It is essential to understand that the correlation between the percentage of German Russians and percentage of population with a disability does not imply a direct cause-and-effect relationship. It remains uncertain whether the presence of German Russians influences an upward or downward trend in the level of percentage of population with a disability within an area, or if German Russians simply ended up residing in those areas with higher or lower levels of percentage of population with a disability due to other factors.
Demographics Similar to German Russians by Disability
In terms of disability, the demographic groups most similar to German Russians are Belgian (12.3%, a difference of 0.030%), Bermudan (12.3%, a difference of 0.33%), Slovene (12.4%, a difference of 0.33%), Immigrants from Dominica (12.4%, a difference of 0.39%), and Immigrants from Laos (12.4%, a difference of 0.49%).
| Demographics | Rating | Rank | Disability |
| Indonesians | 1.4 /100 | #247 | Tragic 12.2% |
| Guamanians/Chamorros | 1.4 /100 | #248 | Tragic 12.3% |
| Carpatho Rusyns | 1.4 /100 | #249 | Tragic 12.3% |
| Sub-Saharan Africans | 1.4 /100 | #250 | Tragic 12.3% |
| Europeans | 1.4 /100 | #251 | Tragic 12.3% |
| Bermudans | 1.1 /100 | #252 | Tragic 12.3% |
| Belgians | 0.8 /100 | #253 | Tragic 12.3% |
| German Russians | 0.8 /100 | #254 | Tragic 12.3% |
| Slovenes | 0.6 /100 | #255 | Tragic 12.4% |
| Immigrants from Dominica | 0.6 /100 | #256 | Tragic 12.4% |
| Immigrants from Laos | 0.5 /100 | #257 | Tragic 12.4% |
| Slavs | 0.5 /100 | #258 | Tragic 12.4% |
| Canadians | 0.4 /100 | #259 | Tragic 12.4% |
| Immigrants from Liberia | 0.4 /100 | #260 | Tragic 12.4% |
| Scandinavians | 0.4 /100 | #261 | Tragic 12.4% |
German Russian Disability Correlation Summary
| Measurement | German Russian Data | Disability Data |
| Minimum | 0.022% | 7.4% |
| Maximum | 27.8% | 25.8% |
| Range | 27.8% | 18.4% |
| Mean | 4.0% | 13.5% |
| Median | 3.2% | 12.8% |
| Interquartile 25% (IQ1) | 1.4% | 11.1% |
| Interquartile 75% (IQ3) | 5.1% | 14.5% |
| Interquartile Range (IQR) | 3.6% | 3.4% |
| Standard Deviation (Sample) | 4.5% | 4.2% |
| Standard Deviation (Population) | 4.5% | 4.2% |
Correlation Details
| German Russian Percentile | Sample Size | Disability |
[ 0.0% - 0.5% ] 0.022% | 90,575,547 | 12.0% |
[ 0.0% - 0.5% ] 0.20% | 3,273,667 | 12.9% |
[ 0.0% - 0.5% ] 0.34% | 1,045,666 | 13.1% |
[ 0.0% - 0.5% ] 0.48% | 533,668 | 12.0% |
[ 0.5% - 1.0% ] 0.62% | 283,179 | 12.9% |
[ 0.5% - 1.0% ] 0.74% | 219,743 | 13.1% |
[ 0.5% - 1.0% ] 0.90% | 56,642 | 12.4% |
[ 1.0% - 1.5% ] 1.03% | 152,983 | 11.0% |
[ 1.0% - 1.5% ] 1.20% | 96,510 | 11.6% |
[ 1.0% - 1.5% ] 1.29% | 73,958 | 11.9% |
[ 1.0% - 1.5% ] 1.44% | 11,457 | 7.9% |
[ 1.5% - 2.0% ] 1.56% | 43,367 | 12.8% |
[ 1.5% - 2.0% ] 1.73% | 1,737 | 16.9% |
[ 1.5% - 2.0% ] 1.84% | 37,816 | 12.3% |
[ 2.0% - 2.5% ] 2.05% | 6,103 | 21.3% |
[ 2.0% - 2.5% ] 2.16% | 9,209 | 7.7% |
[ 2.0% - 2.5% ] 2.32% | 7,938 | 17.0% |
[ 2.5% - 3.0% ] 2.54% | 2,397 | 12.1% |
[ 2.5% - 3.0% ] 2.84% | 2,679 | 11.9% |
[ 2.5% - 3.0% ] 2.95% | 611 | 16.7% |
[ 3.0% - 3.5% ] 3.15% | 349 | 7.4% |
[ 3.0% - 3.5% ] 3.23% | 2,288 | 10.3% |
[ 3.0% - 3.5% ] 3.44% | 1,280 | 13.8% |
[ 3.5% - 4.0% ] 3.56% | 12,593 | 12.1% |
[ 3.5% - 4.0% ] 3.67% | 109 | 23.9% |
[ 4.0% - 4.5% ] 4.00% | 25 | 8.0% |
[ 4.0% - 4.5% ] 4.10% | 2,292 | 9.9% |
[ 4.0% - 4.5% ] 4.40% | 455 | 14.1% |
[ 4.5% - 5.0% ] 4.52% | 951 | 9.9% |
[ 4.5% - 5.0% ] 4.80% | 125 | 12.8% |
[ 4.5% - 5.0% ] 4.97% | 523 | 14.3% |
[ 5.0% - 5.5% ] 5.07% | 138 | 14.5% |
[ 5.0% - 5.5% ] 5.32% | 808 | 13.8% |
[ 5.5% - 6.0% ] 5.50% | 218 | 8.7% |
[ 5.5% - 6.0% ] 5.82% | 464 | 14.2% |
[ 5.5% - 6.0% ] 5.97% | 703 | 24.2% |
[ 6.0% - 6.5% ] 6.12% | 49 | 10.2% |
[ 6.0% - 6.5% ] 6.45% | 31 | 25.8% |
[ 7.0% - 7.5% ] 7.36% | 231 | 14.7% |
[ 7.5% - 8.0% ] 7.78% | 90 | 15.6% |
[ 12.0% - 12.5% ] 12.50% | 16 | 18.8% |
[ 27.5% - 28.0% ] 27.78% | 18 | 11.1% |