Comanche Male Disability
COMPARE
Comanche
Select to Compare
Male Disability
Comanche Male Disability
14.1%
DISABILITY | MALES
0.0/ 100
METRIC RATING
324th/ 347
METRIC RANK
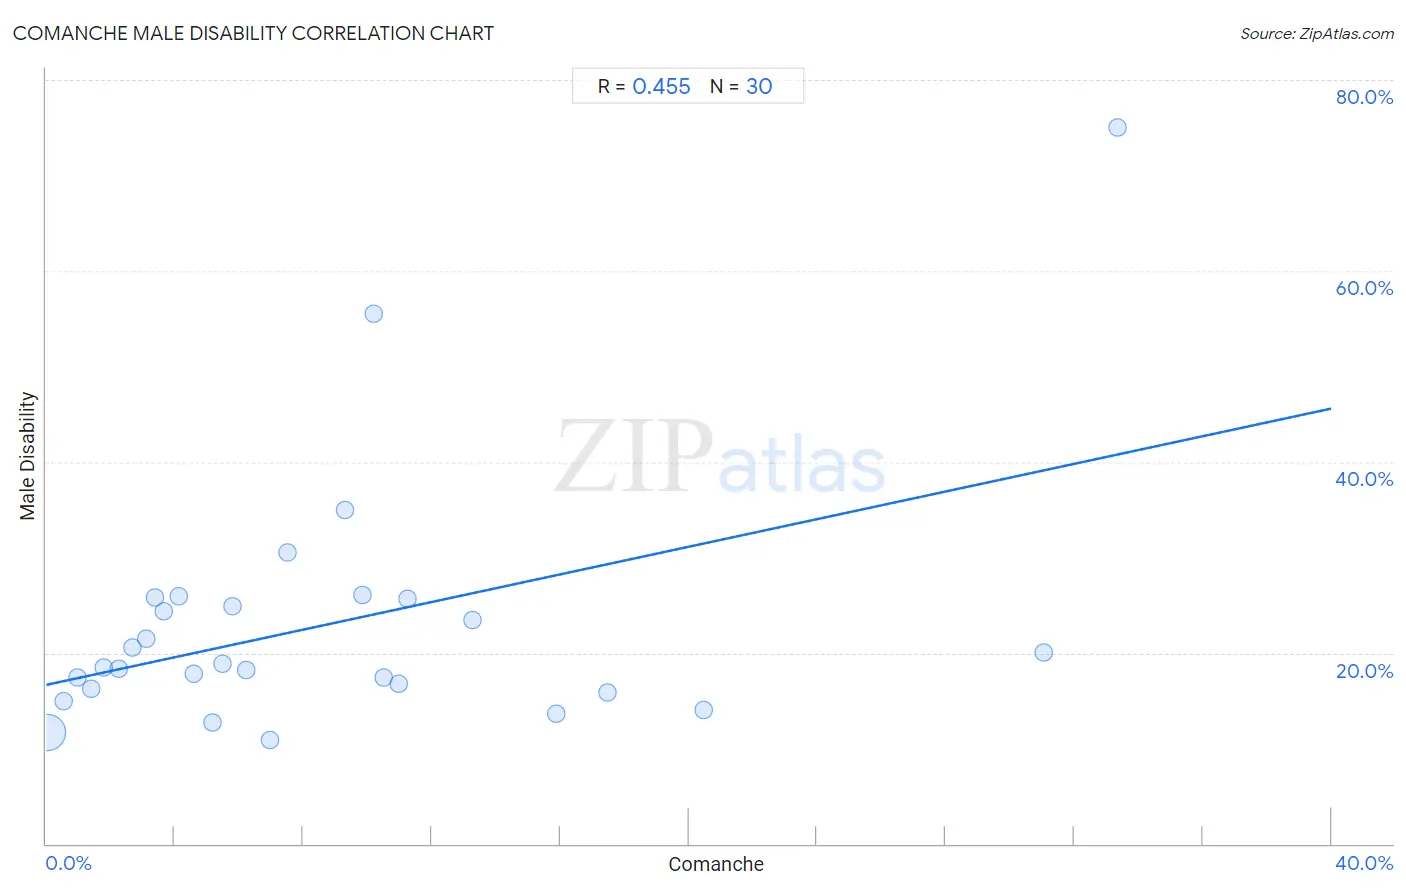
Comanche Male Disability Correlation Chart
The statistical analysis conducted on geographies consisting of 109,776,737 people shows a moderate positive correlation between the proportion of Comanche and percentage of males with a disability in the United States with a correlation coefficient (R) of 0.455 and weighted average of 14.1%. On average, for every 1% (one percent) increase in Comanche within a typical geography, there is an increase of 0.72% in percentage of males with a disability.
It is essential to understand that the correlation between the percentage of Comanche and percentage of males with a disability does not imply a direct cause-and-effect relationship. It remains uncertain whether the presence of Comanche influences an upward or downward trend in the level of percentage of males with a disability within an area, or if Comanche simply ended up residing in those areas with higher or lower levels of percentage of males with a disability due to other factors.
Demographics Similar to Comanche by Male Disability
In terms of male disability, the demographic groups most similar to Comanche are Ottawa (14.1%, a difference of 0.11%), Osage (14.0%, a difference of 0.33%), Apache (14.0%, a difference of 0.40%), Native/Alaskan (14.2%, a difference of 1.1%), and Potawatomi (14.2%, a difference of 1.1%).
| Demographics | Rating | Rank | Male Disability |
| Paiute | 0.0 /100 | #317 | Tragic 13.7% |
| Cree | 0.0 /100 | #318 | Tragic 13.7% |
| Americans | 0.0 /100 | #319 | Tragic 13.8% |
| Tlingit-Haida | 0.0 /100 | #320 | Tragic 13.8% |
| Shoshone | 0.0 /100 | #321 | Tragic 13.8% |
| Apache | 0.0 /100 | #322 | Tragic 14.0% |
| Osage | 0.0 /100 | #323 | Tragic 14.0% |
| Comanche | 0.0 /100 | #324 | Tragic 14.1% |
| Ottawa | 0.0 /100 | #325 | Tragic 14.1% |
| Natives/Alaskans | 0.0 /100 | #326 | Tragic 14.2% |
| Potawatomi | 0.0 /100 | #327 | Tragic 14.2% |
| Chippewa | 0.0 /100 | #328 | Tragic 14.3% |
| Cajuns | 0.0 /100 | #329 | Tragic 14.4% |
| Navajo | 0.0 /100 | #330 | Tragic 14.4% |
| Tohono O'odham | 0.0 /100 | #331 | Tragic 14.6% |
Comanche Male Disability Correlation Summary
| Measurement | Comanche Data | Male Disability Data |
| Minimum | 0.034% | 10.8% |
| Maximum | 33.3% | 75.0% |
| Range | 33.3% | 64.2% |
| Mean | 8.6% | 22.9% |
| Median | 6.0% | 18.7% |
| Interquartile 25% (IQ1) | 3.1% | 16.2% |
| Interquartile 75% (IQ3) | 11.0% | 25.7% |
| Interquartile Range (IQR) | 7.9% | 9.5% |
| Standard Deviation (Sample) | 8.2% | 13.1% |
| Standard Deviation (Population) | 8.1% | 12.8% |
Correlation Details
| Comanche Percentile | Sample Size | Male Disability |
[ 0.0% - 0.5% ] 0.034% | 108,077,396 | 11.7% |
[ 0.5% - 1.0% ] 0.53% | 1,132,107 | 14.9% |
[ 0.5% - 1.0% ] 0.98% | 165,510 | 17.4% |
[ 1.0% - 1.5% ] 1.40% | 64,639 | 16.2% |
[ 1.5% - 2.0% ] 1.80% | 37,119 | 18.5% |
[ 2.0% - 2.5% ] 2.26% | 19,705 | 18.3% |
[ 2.5% - 3.0% ] 2.69% | 159,813 | 20.5% |
[ 3.0% - 3.5% ] 3.12% | 35,008 | 21.5% |
[ 3.0% - 3.5% ] 3.38% | 6,885 | 25.8% |
[ 3.5% - 4.0% ] 3.65% | 25,958 | 24.3% |
[ 4.0% - 4.5% ] 4.11% | 1,654 | 25.9% |
[ 4.5% - 5.0% ] 4.61% | 4,145 | 17.8% |
[ 5.0% - 5.5% ] 5.18% | 4,966 | 12.7% |
[ 5.5% - 6.0% ] 5.50% | 10,507 | 18.9% |
[ 5.5% - 6.0% ] 5.78% | 2,994 | 24.9% |
[ 6.0% - 6.5% ] 6.23% | 6,086 | 18.2% |
[ 6.5% - 7.0% ] 6.98% | 2,520 | 10.8% |
[ 7.0% - 7.5% ] 7.49% | 3,230 | 30.5% |
[ 9.0% - 9.5% ] 9.29% | 312 | 34.9% |
[ 9.5% - 10.0% ] 9.83% | 2,563 | 26.0% |
[ 10.0% - 10.5% ] 10.20% | 49 | 55.6% |
[ 10.5% - 11.0% ] 10.52% | 4,867 | 17.4% |
[ 10.5% - 11.0% ] 10.99% | 1,438 | 16.8% |
[ 11.0% - 11.5% ] 11.26% | 1,377 | 25.7% |
[ 13.0% - 13.5% ] 13.27% | 1,341 | 23.4% |
[ 15.5% - 16.0% ] 15.87% | 2,974 | 13.6% |
[ 17.0% - 17.5% ] 17.46% | 1,065 | 15.8% |
[ 20.0% - 20.5% ] 20.49% | 288 | 14.0% |
[ 31.0% - 31.5% ] 31.03% | 203 | 20.0% |
[ 33.0% - 33.5% ] 33.33% | 18 | 75.0% |