Comanche Unemployment Among Women with Children Ages 6 to 17 years
COMPARE
Comanche
Select to Compare
Unemployment Among Women with Children Ages 6 to 17 years
Comanche Unemployment Among Women with Children Ages 6 to 17 years
9.0%
UNEMPLOYMENT | WOMEN W/ CHILDREN 6 TO 17
30.0/ 100
METRIC RATING
187th/ 347
METRIC RANK
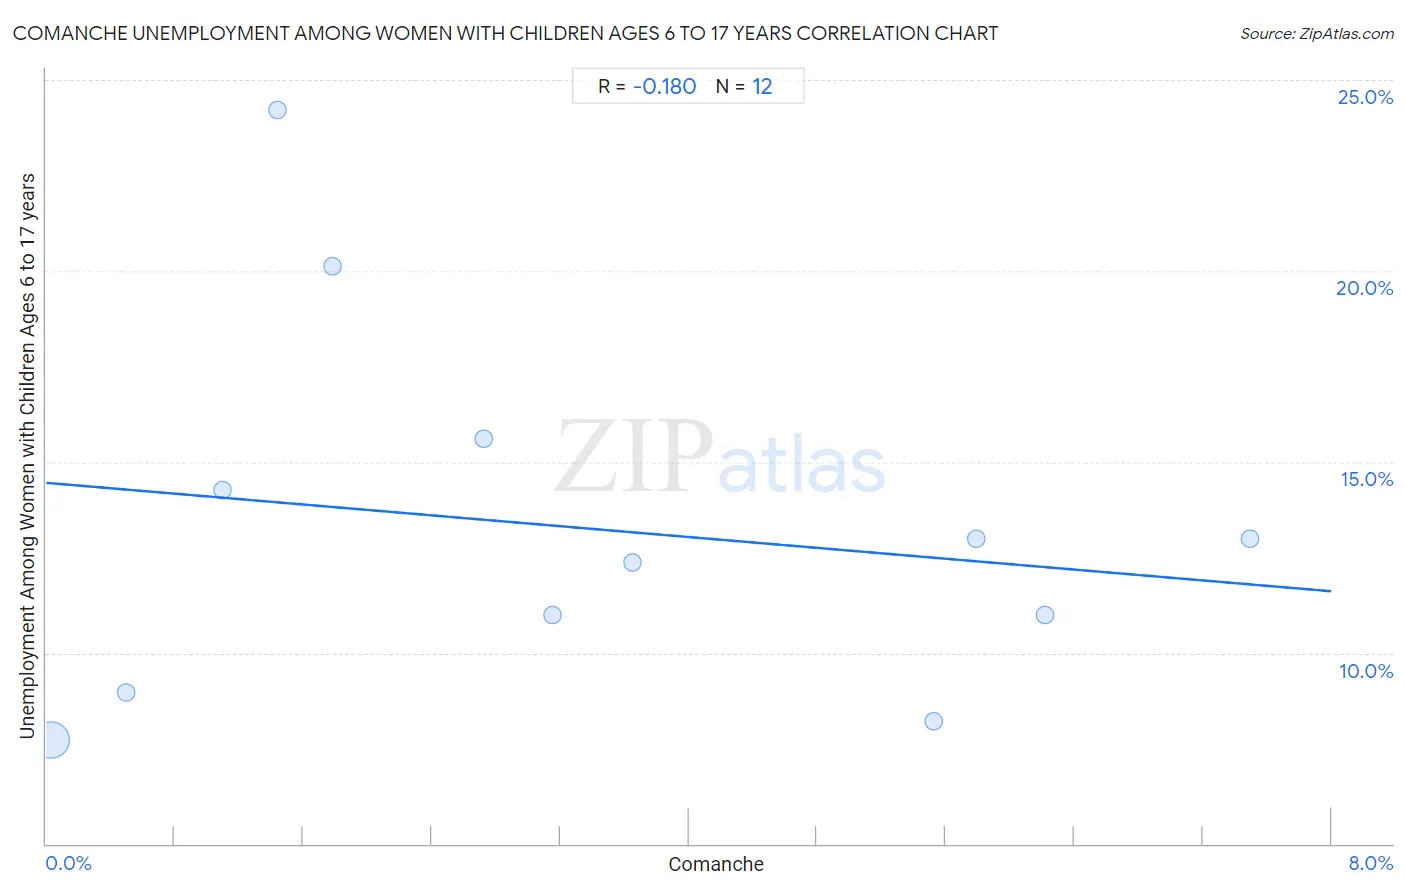
Comanche Unemployment Among Women with Children Ages 6 to 17 years Correlation Chart
The statistical analysis conducted on geographies consisting of 95,114,183 people shows a poor negative correlation between the proportion of Comanche and unemployment rate among women with children between the ages 6 and 17 in the United States with a correlation coefficient (R) of -0.180 and weighted average of 9.0%. On average, for every 1% (one percent) increase in Comanche within a typical geography, there is a decrease of 0.35% in unemployment rate among women with children between the ages 6 and 17.
It is essential to understand that the correlation between the percentage of Comanche and unemployment rate among women with children between the ages 6 and 17 does not imply a direct cause-and-effect relationship. It remains uncertain whether the presence of Comanche influences an upward or downward trend in the level of unemployment rate among women with children between the ages 6 and 17 within an area, or if Comanche simply ended up residing in those areas with higher or lower levels of unemployment rate among women with children between the ages 6 and 17 due to other factors.
Demographics Similar to Comanche by Unemployment Among Women with Children Ages 6 to 17 years
In terms of unemployment among women with children ages 6 to 17 years, the demographic groups most similar to Comanche are Immigrants from Syria (9.1%, a difference of 0.020%), Immigrants (9.1%, a difference of 0.050%), Slovene (9.1%, a difference of 0.080%), Belizean (9.1%, a difference of 0.080%), and Immigrants from Spain (9.0%, a difference of 0.12%).
| Demographics | Rating | Rank | Unemployment Among Women with Children Ages 6 to 17 years |
| Ethiopians | 37.6 /100 | #180 | Fair 9.0% |
| Immigrants from Czechoslovakia | 34.5 /100 | #181 | Fair 9.0% |
| South American Indians | 34.4 /100 | #182 | Fair 9.0% |
| Swiss | 33.5 /100 | #183 | Fair 9.0% |
| Palestinians | 33.4 /100 | #184 | Fair 9.0% |
| Immigrants from Congo | 32.5 /100 | #185 | Fair 9.0% |
| Immigrants from Spain | 32.4 /100 | #186 | Fair 9.0% |
| Comanche | 30.0 /100 | #187 | Fair 9.0% |
| Immigrants from Syria | 29.7 /100 | #188 | Fair 9.1% |
| Immigrants | 29.2 /100 | #189 | Fair 9.1% |
| Slovenes | 28.5 /100 | #190 | Fair 9.1% |
| Belizeans | 28.4 /100 | #191 | Fair 9.1% |
| Guamanians/Chamorros | 27.2 /100 | #192 | Fair 9.1% |
| Immigrants from Turkey | 25.8 /100 | #193 | Fair 9.1% |
| Immigrants from Kazakhstan | 25.3 /100 | #194 | Fair 9.1% |
Comanche Unemployment Among Women with Children Ages 6 to 17 years Correlation Summary
| Measurement | Comanche Data | Unemployment Among Women with Children Ages 6 to 17 years Data |
| Minimum | 0.028% | 7.7% |
| Maximum | 7.5% | 24.2% |
| Range | 7.5% | 16.5% |
| Mean | 3.3% | 13.3% |
| Median | 2.9% | 12.7% |
| Interquartile 25% (IQ1) | 1.3% | 10.0% |
| Interquartile 75% (IQ3) | 5.7% | 14.9% |
| Interquartile Range (IQR) | 4.4% | 4.9% |
| Standard Deviation (Sample) | 2.5% | 4.9% |
| Standard Deviation (Population) | 2.4% | 4.7% |
Correlation Details
| Comanche Percentile | Sample Size | Unemployment Among Women with Children Ages 6 to 17 years |
[ 0.0% - 0.5% ] 0.028% | 94,428,189 | 7.7% |
[ 0.0% - 0.5% ] 0.50% | 447,204 | 9.0% |
[ 1.0% - 1.5% ] 1.10% | 19,323 | 14.3% |
[ 1.0% - 1.5% ] 1.44% | 13,684 | 24.2% |
[ 1.5% - 2.0% ] 1.78% | 3,255 | 20.1% |
[ 2.5% - 3.0% ] 2.72% | 138,681 | 15.6% |
[ 3.0% - 3.5% ] 3.15% | 20,630 | 11.0% |
[ 3.5% - 4.0% ] 3.65% | 23,950 | 12.4% |
[ 5.5% - 6.0% ] 5.53% | 8,033 | 8.2% |
[ 5.5% - 6.0% ] 5.79% | 2,281 | 13.0% |
[ 6.0% - 6.5% ] 6.22% | 5,723 | 11.0% |
[ 7.0% - 7.5% ] 7.49% | 3,230 | 13.0% |