Comanche 3 or more Vehicles in Household
COMPARE
Comanche
Select to Compare
3 or more Vehicles in Household
Comanche 3 or more Vehicles in Household
21.0%
3+ VEHICLES AVAILABLE
98.2/ 100
METRIC RATING
100th/ 347
METRIC RANK
Comanche 3 or more Vehicles in Household Correlation Chart
The statistical analysis conducted on geographies consisting of 109,768,043 people shows a very strong positive correlation between the proportion of Comanche and percentage of households with 3 or more vehicles available in the United States with a correlation coefficient (R) of 0.813 and weighted average of 21.0%. On average, for every 1% (one percent) increase in Comanche within a typical geography, there is an increase of 0.83% in percentage of households with 3 or more vehicles available.
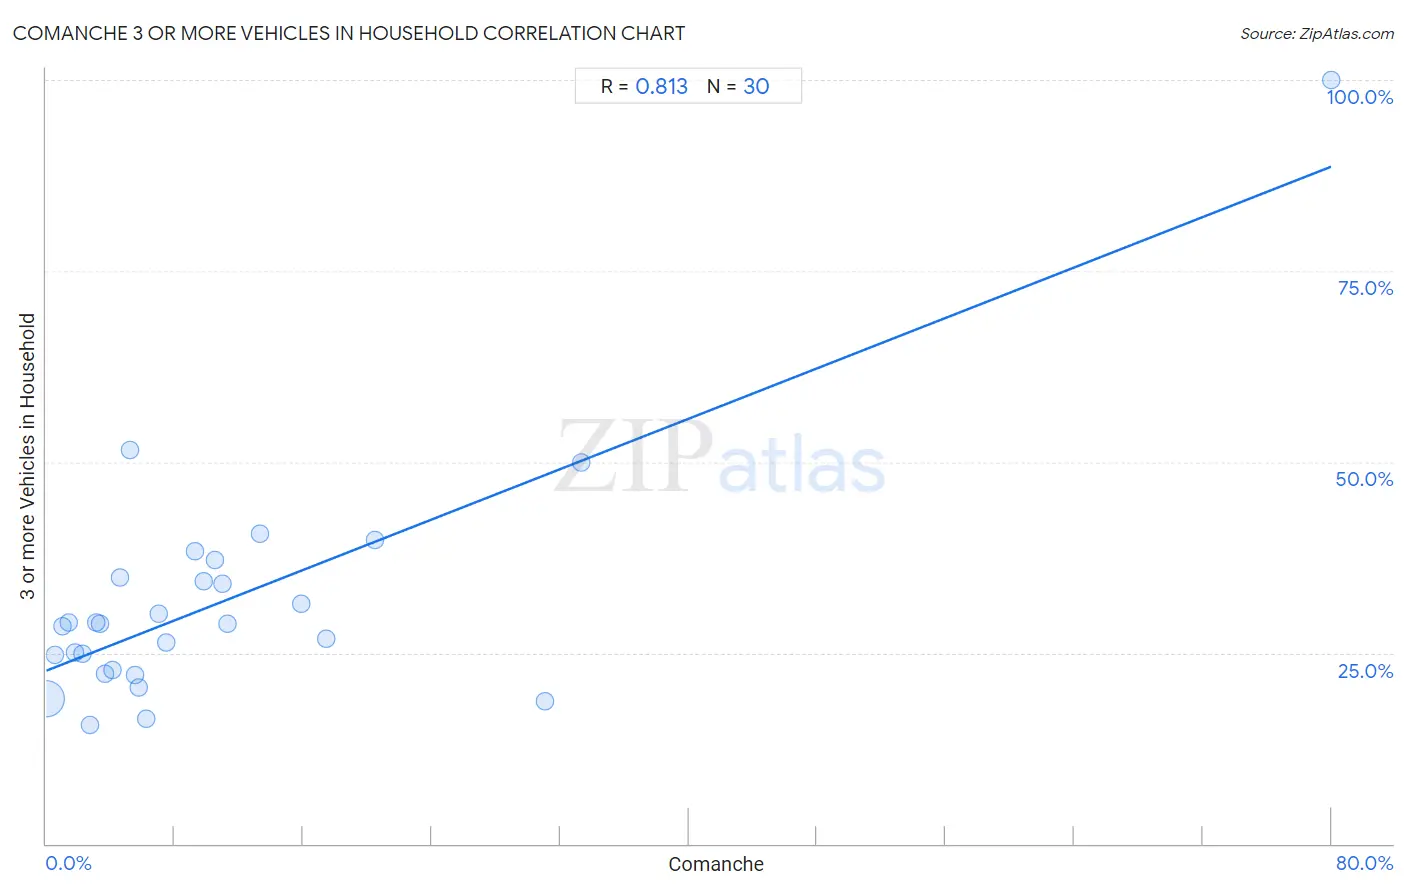
It is essential to understand that the correlation between the percentage of Comanche and percentage of households with 3 or more vehicles available does not imply a direct cause-and-effect relationship. It remains uncertain whether the presence of Comanche influences an upward or downward trend in the level of percentage of households with 3 or more vehicles available within an area, or if Comanche simply ended up residing in those areas with higher or lower levels of percentage of households with 3 or more vehicles available due to other factors.
Demographics Similar to Comanche by 3 or more Vehicles in Household
In terms of 3 or more vehicles in household, the demographic groups most similar to Comanche are Hmong (21.0%, a difference of 0.040%), Alaska Native (21.0%, a difference of 0.040%), Canadian (21.0%, a difference of 0.10%), Cree (21.0%, a difference of 0.21%), and Pakistani (21.0%, a difference of 0.30%).
| Demographics | Rating | Rank | 3 or more Vehicles in Household |
| Immigrants from Indonesia | 98.8 /100 | #93 | Exceptional 21.1% |
| Immigrants from Cambodia | 98.6 /100 | #94 | Exceptional 21.1% |
| Pakistanis | 98.5 /100 | #95 | Exceptional 21.0% |
| Cree | 98.4 /100 | #96 | Exceptional 21.0% |
| Canadians | 98.3 /100 | #97 | Exceptional 21.0% |
| Hmong | 98.2 /100 | #98 | Exceptional 21.0% |
| Alaska Natives | 98.2 /100 | #99 | Exceptional 21.0% |
| Comanche | 98.2 /100 | #100 | Exceptional 21.0% |
| Blackfeet | 97.9 /100 | #101 | Exceptional 20.9% |
| Seminole | 97.8 /100 | #102 | Exceptional 20.9% |
| Dutch West Indians | 97.8 /100 | #103 | Exceptional 20.9% |
| Luxembourgers | 97.7 /100 | #104 | Exceptional 20.9% |
| Austrians | 97.5 /100 | #105 | Exceptional 20.9% |
| Bolivians | 97.4 /100 | #106 | Exceptional 20.8% |
| Immigrants from Germany | 97.4 /100 | #107 | Exceptional 20.8% |
Comanche 3 or more Vehicles in Household Correlation Summary
| Measurement | Comanche Data | 3 or more Vehicles in Household Data |
| Minimum | 0.034% | 15.6% |
| Maximum | 80.0% | 100.0% |
| Range | 80.0% | 84.4% |
| Mean | 11.0% | 31.7% |
| Median | 6.0% | 28.8% |
| Interquartile 25% (IQ1) | 3.1% | 22.8% |
| Interquartile 75% (IQ3) | 11.3% | 34.9% |
| Interquartile Range (IQR) | 8.1% | 12.1% |
| Standard Deviation (Sample) | 15.4% | 15.6% |
| Standard Deviation (Population) | 15.1% | 15.4% |
Correlation Details
| Comanche Percentile | Sample Size | 3 or more Vehicles in Household |
[ 0.0% - 0.5% ] 0.034% | 108,068,473 | 19.0% |
[ 0.5% - 1.0% ] 0.53% | 1,132,107 | 24.7% |
[ 0.5% - 1.0% ] 0.98% | 165,510 | 28.5% |
[ 1.0% - 1.5% ] 1.40% | 64,639 | 29.0% |
[ 1.5% - 2.0% ] 1.80% | 37,119 | 25.0% |
[ 2.0% - 2.5% ] 2.26% | 19,946 | 25.0% |
[ 2.5% - 3.0% ] 2.69% | 159,813 | 15.6% |
[ 3.0% - 3.5% ] 3.12% | 35,040 | 29.0% |
[ 3.0% - 3.5% ] 3.38% | 6,885 | 28.7% |
[ 3.5% - 4.0% ] 3.65% | 25,958 | 22.2% |
[ 4.0% - 4.5% ] 4.11% | 1,654 | 22.8% |
[ 4.5% - 5.0% ] 4.61% | 4,145 | 34.9% |
[ 5.0% - 5.5% ] 5.18% | 4,966 | 51.6% |
[ 5.5% - 6.0% ] 5.50% | 10,507 | 22.0% |
[ 5.5% - 6.0% ] 5.78% | 2,994 | 20.5% |
[ 6.0% - 6.5% ] 6.23% | 6,086 | 16.3% |
[ 6.5% - 7.0% ] 6.98% | 2,520 | 30.2% |
[ 7.0% - 7.5% ] 7.49% | 3,230 | 26.3% |
[ 9.0% - 9.5% ] 9.29% | 312 | 38.3% |
[ 9.5% - 10.0% ] 9.83% | 2,563 | 34.4% |
[ 10.5% - 11.0% ] 10.52% | 4,867 | 37.2% |
[ 10.5% - 11.0% ] 10.99% | 1,438 | 34.0% |
[ 11.0% - 11.5% ] 11.26% | 1,377 | 28.8% |
[ 13.0% - 13.5% ] 13.27% | 1,341 | 40.6% |
[ 15.5% - 16.0% ] 15.87% | 2,974 | 31.5% |
[ 17.0% - 17.5% ] 17.46% | 1,065 | 26.8% |
[ 20.0% - 20.5% ] 20.49% | 288 | 39.8% |
[ 31.0% - 31.5% ] 31.03% | 203 | 18.6% |
[ 33.0% - 33.5% ] 33.33% | 18 | 50.0% |
[ 80.0% - 80.5% ] 80.00% | 5 | 100.0% |