Chickasaw GED/Equivalency
COMPARE
Chickasaw
Select to Compare
GED/Equivalency
Chickasaw GED/Equivalency
83.8%
GED/EQUIVALENCY
1.2/ 100
METRIC RATING
246th/ 347
METRIC RANK
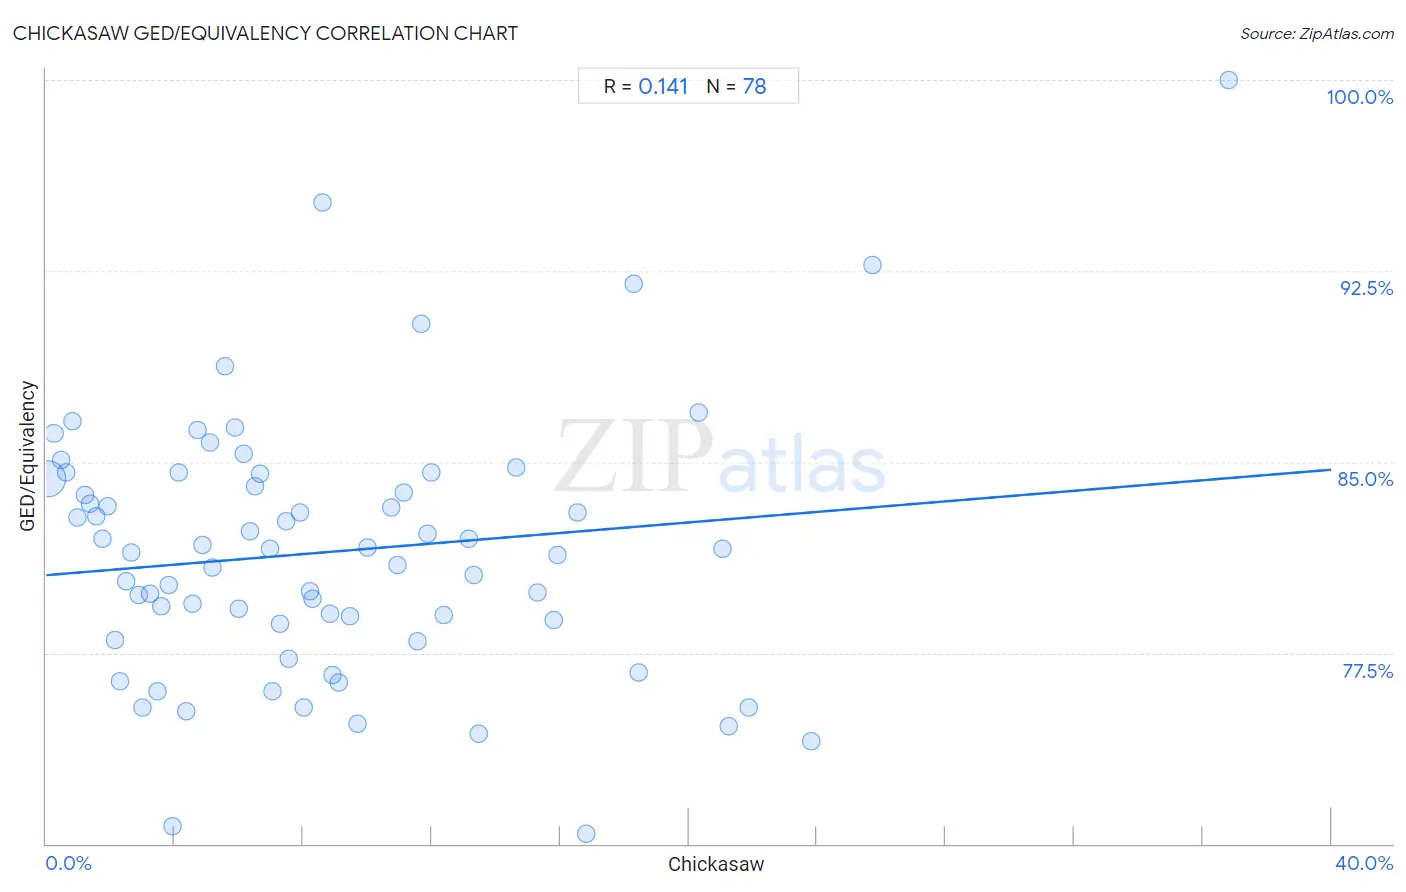
Chickasaw GED/Equivalency Correlation Chart
The statistical analysis conducted on geographies consisting of 147,726,505 people shows a poor positive correlation between the proportion of Chickasaw and percentage of population with at least ged/equivalency education in the United States with a correlation coefficient (R) of 0.141 and weighted average of 83.8%. On average, for every 1% (one percent) increase in Chickasaw within a typical geography, there is an increase of 0.10% in percentage of population with at least ged/equivalency education.
It is essential to understand that the correlation between the percentage of Chickasaw and percentage of population with at least ged/equivalency education does not imply a direct cause-and-effect relationship. It remains uncertain whether the presence of Chickasaw influences an upward or downward trend in the level of percentage of population with at least ged/equivalency education within an area, or if Chickasaw simply ended up residing in those areas with higher or lower levels of percentage of population with at least ged/equivalency education due to other factors.
Demographics Similar to Chickasaw by GED/Equivalency
In terms of ged/equivalency, the demographic groups most similar to Chickasaw are Immigrants from Senegal (83.8%, a difference of 0.020%), Immigrants from Western Africa (83.8%, a difference of 0.030%), Immigrants from Ghana (83.9%, a difference of 0.050%), Blackfeet (83.8%, a difference of 0.050%), and Crow (83.8%, a difference of 0.050%).
| Demographics | Rating | Rank | GED/Equivalency |
| Immigrants from Bahamas | 2.6 /100 | #239 | Tragic 84.2% |
| Immigrants from South Eastern Asia | 2.5 /100 | #240 | Tragic 84.1% |
| Senegalese | 1.9 /100 | #241 | Tragic 84.0% |
| Sri Lankans | 1.9 /100 | #242 | Tragic 84.0% |
| Cherokee | 1.3 /100 | #243 | Tragic 83.9% |
| Immigrants from Ghana | 1.3 /100 | #244 | Tragic 83.9% |
| Immigrants from Senegal | 1.2 /100 | #245 | Tragic 83.8% |
| Chickasaw | 1.2 /100 | #246 | Tragic 83.8% |
| Immigrants from Western Africa | 1.1 /100 | #247 | Tragic 83.8% |
| Blackfeet | 1.1 /100 | #248 | Tragic 83.8% |
| Crow | 1.1 /100 | #249 | Tragic 83.8% |
| Shoshone | 1.0 /100 | #250 | Tragic 83.7% |
| Spanish Americans | 0.8 /100 | #251 | Tragic 83.6% |
| Bahamians | 0.8 /100 | #252 | Tragic 83.6% |
| Comanche | 0.7 /100 | #253 | Tragic 83.6% |
Chickasaw GED/Equivalency Correlation Summary
| Measurement | Chickasaw Data | GED/Equivalency Data |
| Minimum | 0.032% | 70.4% |
| Maximum | 36.8% | 100.0% |
| Range | 36.8% | 29.6% |
| Mean | 8.8% | 81.5% |
| Median | 7.4% | 81.5% |
| Interquartile 25% (IQ1) | 3.6% | 78.6% |
| Interquartile 75% (IQ3) | 12.0% | 84.3% |
| Interquartile Range (IQR) | 8.4% | 5.7% |
| Standard Deviation (Sample) | 7.0% | 5.1% |
| Standard Deviation (Population) | 6.9% | 5.1% |
Correlation Details
| Chickasaw Percentile | Sample Size | GED/Equivalency |
[ 0.0% - 0.5% ] 0.032% | 136,672,645 | 84.3% |
[ 0.0% - 0.5% ] 0.25% | 5,310,146 | 86.1% |
[ 0.0% - 0.5% ] 0.45% | 1,606,572 | 85.1% |
[ 0.5% - 1.0% ] 0.60% | 1,615,670 | 84.6% |
[ 0.5% - 1.0% ] 0.83% | 826,043 | 86.6% |
[ 0.5% - 1.0% ] 0.99% | 475,295 | 82.8% |
[ 1.0% - 1.5% ] 1.19% | 233,583 | 83.7% |
[ 1.0% - 1.5% ] 1.35% | 249,739 | 83.3% |
[ 1.5% - 2.0% ] 1.54% | 89,231 | 82.9% |
[ 1.5% - 2.0% ] 1.74% | 88,765 | 82.0% |
[ 1.5% - 2.0% ] 1.93% | 53,323 | 83.2% |
[ 2.0% - 2.5% ] 2.13% | 48,029 | 78.0% |
[ 2.0% - 2.5% ] 2.28% | 55,156 | 76.4% |
[ 2.5% - 3.0% ] 2.51% | 15,979 | 80.3% |
[ 2.5% - 3.0% ] 2.66% | 16,025 | 81.5% |
[ 2.5% - 3.0% ] 2.88% | 67,875 | 79.8% |
[ 3.0% - 3.5% ] 3.00% | 18,539 | 75.3% |
[ 3.0% - 3.5% ] 3.24% | 16,118 | 79.8% |
[ 3.0% - 3.5% ] 3.46% | 7,995 | 76.0% |
[ 3.5% - 4.0% ] 3.58% | 7,909 | 79.3% |
[ 3.5% - 4.0% ] 3.83% | 1,750 | 80.1% |
[ 3.5% - 4.0% ] 3.93% | 2,773 | 70.7% |
[ 4.0% - 4.5% ] 4.14% | 4,957 | 84.6% |
[ 4.0% - 4.5% ] 4.35% | 20,308 | 75.2% |
[ 4.5% - 5.0% ] 4.53% | 26,620 | 79.4% |
[ 4.5% - 5.0% ] 4.70% | 4,529 | 86.2% |
[ 4.5% - 5.0% ] 4.86% | 2,552 | 81.7% |
[ 5.0% - 5.5% ] 5.10% | 4,663 | 85.8% |
[ 5.0% - 5.5% ] 5.18% | 40,906 | 80.9% |
[ 5.5% - 6.0% ] 5.57% | 4,596 | 88.8% |
[ 5.5% - 6.0% ] 5.86% | 290 | 86.4% |
[ 5.5% - 6.0% ] 6.00% | 4,318 | 79.2% |
[ 6.0% - 6.5% ] 6.17% | 665 | 85.3% |
[ 6.0% - 6.5% ] 6.36% | 6,967 | 82.3% |
[ 6.5% - 7.0% ] 6.51% | 215 | 84.0% |
[ 6.5% - 7.0% ] 6.65% | 1,234 | 84.5% |
[ 6.5% - 7.0% ] 6.95% | 4,633 | 81.6% |
[ 7.0% - 7.5% ] 7.04% | 1,108 | 76.0% |
[ 7.0% - 7.5% ] 7.28% | 8,632 | 78.6% |
[ 7.0% - 7.5% ] 7.45% | 2,925 | 82.7% |
[ 7.5% - 8.0% ] 7.56% | 6,148 | 77.2% |
[ 7.5% - 8.0% ] 7.88% | 2,449 | 83.0% |
[ 8.0% - 8.5% ] 8.00% | 350 | 75.4% |
[ 8.0% - 8.5% ] 8.21% | 633 | 79.9% |
[ 8.0% - 8.5% ] 8.29% | 4,329 | 79.6% |
[ 8.5% - 9.0% ] 8.60% | 651 | 95.2% |
[ 8.5% - 9.0% ] 8.81% | 919 | 79.0% |
[ 8.5% - 9.0% ] 8.93% | 1,803 | 76.6% |
[ 9.0% - 9.5% ] 9.11% | 966 | 76.3% |
[ 9.0% - 9.5% ] 9.44% | 4,841 | 79.0% |
[ 9.5% - 10.0% ] 9.69% | 351 | 74.7% |
[ 10.0% - 10.5% ] 10.00% | 7,518 | 81.6% |
[ 10.5% - 11.0% ] 10.75% | 930 | 83.2% |
[ 10.5% - 11.0% ] 10.95% | 5,491 | 81.0% |
[ 11.0% - 11.5% ] 11.15% | 1,283 | 83.8% |
[ 11.5% - 12.0% ] 11.54% | 208 | 78.0% |
[ 11.5% - 12.0% ] 11.68% | 1,516 | 90.4% |
[ 11.5% - 12.0% ] 11.85% | 16,629 | 82.2% |
[ 11.5% - 12.0% ] 11.98% | 31,368 | 84.6% |
[ 12.0% - 12.5% ] 12.37% | 897 | 79.0% |
[ 13.0% - 13.5% ] 13.13% | 8,460 | 82.0% |
[ 13.0% - 13.5% ] 13.31% | 3,110 | 80.6% |
[ 13.0% - 13.5% ] 13.45% | 119 | 74.3% |
[ 14.5% - 15.0% ] 14.64% | 560 | 84.8% |
[ 15.0% - 15.5% ] 15.30% | 791 | 79.9% |
[ 15.5% - 16.0% ] 15.79% | 190 | 78.8% |
[ 15.5% - 16.0% ] 15.93% | 841 | 81.4% |
[ 16.5% - 17.0% ] 16.55% | 145 | 83.0% |
[ 16.5% - 17.0% ] 16.79% | 262 | 70.4% |
[ 18.0% - 18.5% ] 18.29% | 82 | 92.0% |
[ 18.0% - 18.5% ] 18.46% | 428 | 76.7% |
[ 20.0% - 20.5% ] 20.31% | 64 | 87.0% |
[ 21.0% - 21.5% ] 21.05% | 114 | 81.6% |
[ 21.0% - 21.5% ] 21.23% | 212 | 74.6% |
[ 21.5% - 22.0% ] 21.86% | 988 | 75.3% |
[ 23.5% - 24.0% ] 23.81% | 189 | 74.0% |
[ 25.5% - 26.0% ] 25.74% | 1,286 | 92.7% |
[ 36.5% - 37.0% ] 36.79% | 106 | 100.0% |