Bahamian Disability
COMPARE
Bahamian
Select to Compare
Disability
Bahamian Disability
12.2%
DISABILITY
2.3/ 100
METRIC RATING
233rd/ 347
METRIC RANK
Bahamian Disability Correlation Chart
The statistical analysis conducted on geographies consisting of 112,688,060 people shows a weak positive correlation between the proportion of Bahamians and percentage of population with a disability in the United States with a correlation coefficient (R) of 0.274 and weighted average of 12.2%. On average, for every 1% (one percent) increase in Bahamians within a typical geography, there is an increase of 0.68% in percentage of population with a disability.
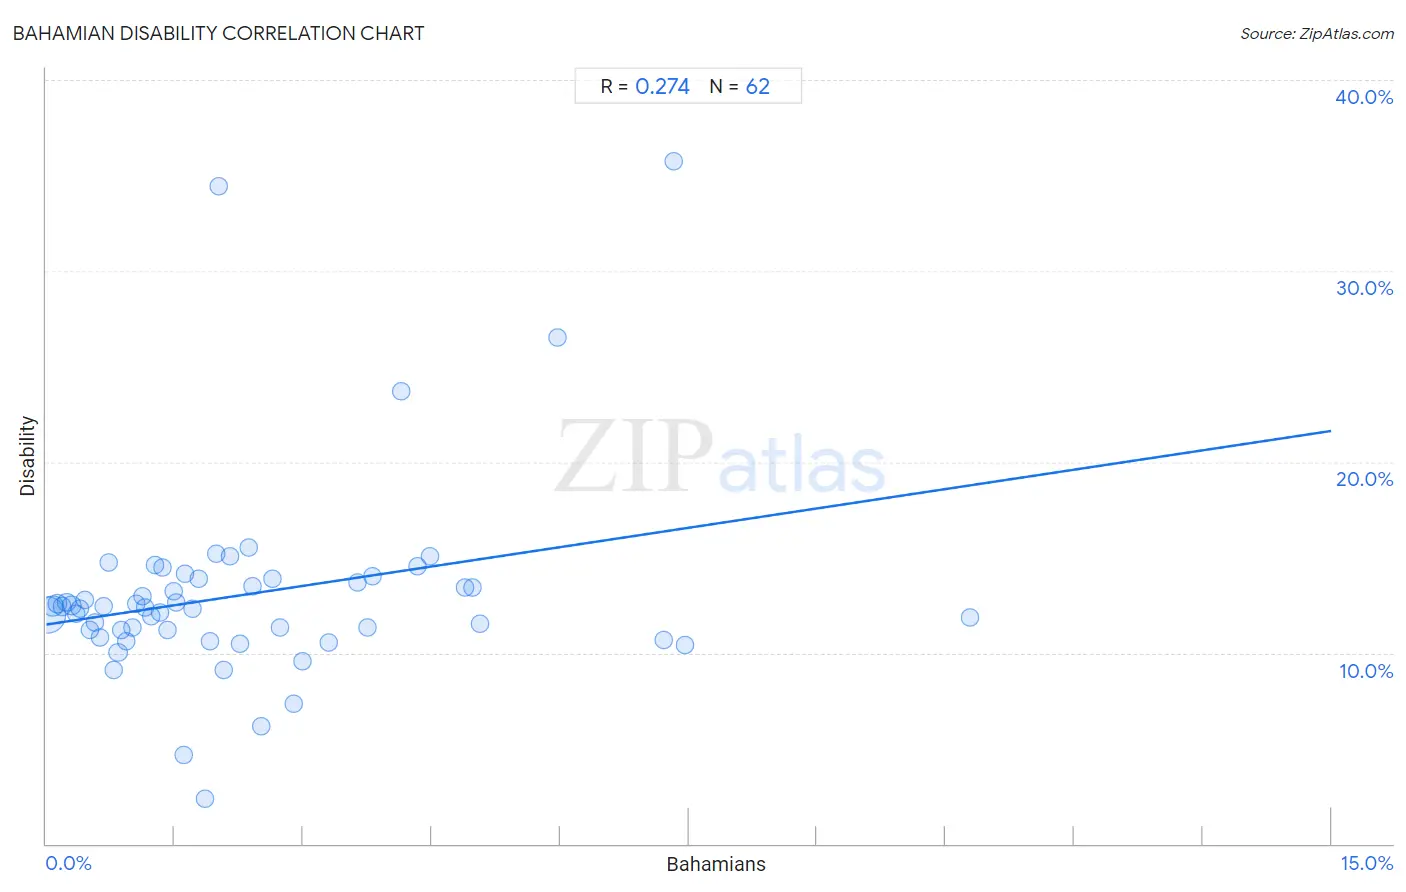
It is essential to understand that the correlation between the percentage of Bahamians and percentage of population with a disability does not imply a direct cause-and-effect relationship. It remains uncertain whether the presence of Bahamians influences an upward or downward trend in the level of percentage of population with a disability within an area, or if Bahamians simply ended up residing in those areas with higher or lower levels of percentage of population with a disability due to other factors.
Demographics Similar to Bahamians by Disability
In terms of disability, the demographic groups most similar to Bahamians are Japanese (12.2%, a difference of 0.030%), Yup'ik (12.2%, a difference of 0.070%), Italian (12.2%, a difference of 0.090%), Malaysian (12.2%, a difference of 0.10%), and Samoan (12.2%, a difference of 0.13%).
| Demographics | Rating | Rank | Disability |
| Jamaicans | 3.3 /100 | #226 | Tragic 12.1% |
| Alsatians | 3.3 /100 | #227 | Tragic 12.1% |
| West Indians | 2.9 /100 | #228 | Tragic 12.2% |
| Inupiat | 2.8 /100 | #229 | Tragic 12.2% |
| Samoans | 2.6 /100 | #230 | Tragic 12.2% |
| Malaysians | 2.5 /100 | #231 | Tragic 12.2% |
| Italians | 2.5 /100 | #232 | Tragic 12.2% |
| Bahamians | 2.3 /100 | #233 | Tragic 12.2% |
| Japanese | 2.3 /100 | #234 | Tragic 12.2% |
| Yup'ik | 2.2 /100 | #235 | Tragic 12.2% |
| Chinese | 2.0 /100 | #236 | Tragic 12.2% |
| Immigrants from Congo | 1.9 /100 | #237 | Tragic 12.2% |
| Norwegians | 1.9 /100 | #238 | Tragic 12.2% |
| Swedes | 1.8 /100 | #239 | Tragic 12.2% |
| Hungarians | 1.7 /100 | #240 | Tragic 12.2% |
Bahamian Disability Correlation Summary
| Measurement | Bahamian Data | Disability Data |
| Minimum | 0.017% | 2.3% |
| Maximum | 10.8% | 35.8% |
| Range | 10.8% | 33.4% |
| Mean | 2.3% | 13.0% |
| Median | 1.7% | 12.4% |
| Interquartile 25% (IQ1) | 0.84% | 11.2% |
| Interquartile 75% (IQ3) | 3.0% | 13.9% |
| Interquartile Range (IQR) | 2.1% | 2.7% |
| Standard Deviation (Sample) | 2.1% | 5.3% |
| Standard Deviation (Population) | 2.1% | 5.2% |
Correlation Details
| Bahamian Percentile | Sample Size | Disability |
[ 0.0% - 0.5% ] 0.017% | 79,575,663 | 12.0% |
[ 0.0% - 0.5% ] 0.077% | 12,673,785 | 12.4% |
[ 0.0% - 0.5% ] 0.13% | 6,207,123 | 12.6% |
[ 0.0% - 0.5% ] 0.19% | 3,578,302 | 12.4% |
[ 0.0% - 0.5% ] 0.24% | 1,431,875 | 12.7% |
[ 0.0% - 0.5% ] 0.29% | 1,862,752 | 12.5% |
[ 0.0% - 0.5% ] 0.35% | 892,171 | 12.1% |
[ 0.0% - 0.5% ] 0.40% | 749,143 | 12.3% |
[ 0.0% - 0.5% ] 0.46% | 707,966 | 12.8% |
[ 0.5% - 1.0% ] 0.51% | 747,421 | 11.2% |
[ 0.5% - 1.0% ] 0.57% | 569,471 | 11.6% |
[ 0.5% - 1.0% ] 0.62% | 510,579 | 10.8% |
[ 0.5% - 1.0% ] 0.67% | 574,611 | 12.4% |
[ 0.5% - 1.0% ] 0.73% | 287,663 | 14.7% |
[ 0.5% - 1.0% ] 0.79% | 221,731 | 9.1% |
[ 0.5% - 1.0% ] 0.84% | 264,243 | 10.0% |
[ 0.5% - 1.0% ] 0.88% | 135,630 | 11.2% |
[ 0.5% - 1.0% ] 0.94% | 189,649 | 10.6% |
[ 0.5% - 1.0% ] 1.00% | 296,445 | 11.3% |
[ 1.0% - 1.5% ] 1.05% | 70,662 | 12.6% |
[ 1.0% - 1.5% ] 1.12% | 46,612 | 13.0% |
[ 1.0% - 1.5% ] 1.15% | 60,436 | 12.3% |
[ 1.0% - 1.5% ] 1.23% | 31,590 | 11.9% |
[ 1.0% - 1.5% ] 1.27% | 109,884 | 14.6% |
[ 1.0% - 1.5% ] 1.33% | 74,297 | 12.1% |
[ 1.0% - 1.5% ] 1.36% | 25,473 | 14.5% |
[ 1.0% - 1.5% ] 1.42% | 19,010 | 11.2% |
[ 1.0% - 1.5% ] 1.48% | 145,059 | 13.3% |
[ 1.5% - 2.0% ] 1.52% | 176,766 | 12.7% |
[ 1.5% - 2.0% ] 1.60% | 3,247 | 4.6% |
[ 1.5% - 2.0% ] 1.62% | 48,077 | 14.1% |
[ 1.5% - 2.0% ] 1.70% | 86,097 | 12.3% |
[ 1.5% - 2.0% ] 1.78% | 338 | 13.9% |
[ 1.5% - 2.0% ] 1.86% | 1,506 | 2.3% |
[ 1.5% - 2.0% ] 1.91% | 47,981 | 10.6% |
[ 1.5% - 2.0% ] 1.98% | 14,126 | 15.2% |
[ 2.0% - 2.5% ] 2.01% | 947 | 34.4% |
[ 2.0% - 2.5% ] 2.07% | 8,340 | 9.1% |
[ 2.0% - 2.5% ] 2.15% | 37,274 | 15.1% |
[ 2.0% - 2.5% ] 2.26% | 2,349 | 10.5% |
[ 2.0% - 2.5% ] 2.37% | 7,689 | 15.5% |
[ 2.0% - 2.5% ] 2.40% | 16,449 | 13.5% |
[ 2.5% - 3.0% ] 2.51% | 3,192 | 6.1% |
[ 2.5% - 3.0% ] 2.64% | 2,576 | 13.9% |
[ 2.5% - 3.0% ] 2.73% | 48,792 | 11.3% |
[ 2.5% - 3.0% ] 2.88% | 27,583 | 7.3% |
[ 2.5% - 3.0% ] 2.98% | 6,266 | 9.5% |
[ 3.0% - 3.5% ] 3.30% | 7,385 | 10.5% |
[ 3.5% - 4.0% ] 3.64% | 9,677 | 13.7% |
[ 3.5% - 4.0% ] 3.74% | 1,950 | 11.3% |
[ 3.5% - 4.0% ] 3.81% | 18,487 | 14.0% |
[ 4.0% - 4.5% ] 4.14% | 1,714 | 23.7% |
[ 4.0% - 4.5% ] 4.34% | 8,118 | 14.5% |
[ 4.0% - 4.5% ] 4.48% | 15,735 | 15.1% |
[ 4.5% - 5.0% ] 4.89% | 2,190 | 13.4% |
[ 4.5% - 5.0% ] 4.97% | 2,151 | 13.4% |
[ 5.0% - 5.5% ] 5.07% | 2,426 | 11.5% |
[ 5.5% - 6.0% ] 5.97% | 486 | 26.5% |
[ 7.0% - 7.5% ] 7.21% | 14,698 | 10.6% |
[ 7.0% - 7.5% ] 7.32% | 1,011 | 35.8% |
[ 7.0% - 7.5% ] 7.45% | 1,651 | 10.4% |
[ 10.5% - 11.0% ] 10.78% | 1,540 | 11.8% |